
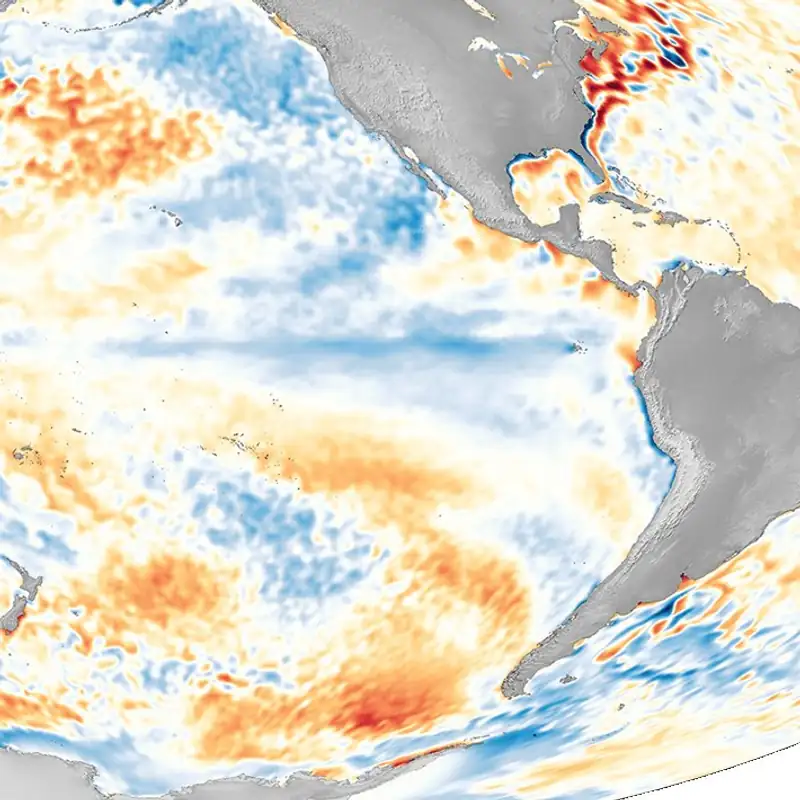

The U.S. National Oceanic and Atmospheric Administration (NOAA) announced the return of La Niña in early October 2025. A weak La Niña is expected to persist through February 2026, after which ENSO (the El Niño–Southern Oscillation) is most likely to return to neutral conditions, with a 55% chance. However, some models suggest a rapid transition to El Niño in boreal spring/austral autumn 2026.
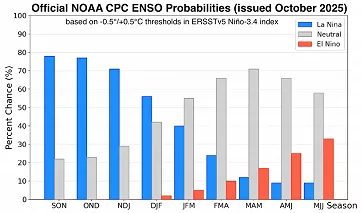
La Niña conditions are present and favored to persist through December 2025–February 2026; NOAA Climate Prediction Center
Statistics show that La Niña generally has a cooling effect on the global mean temperature, and that in La Niña years, winters in western Canada, the northwestern United States (Pacific Northwest), and East Asia (including eastern China, Korea, and Japan) tend to be colder.
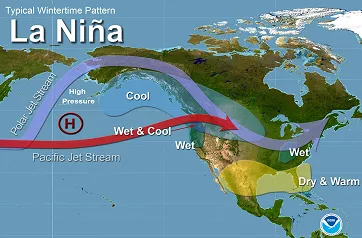
Typical winter pattern during La Niña in North America; NOAA Pacific Marine Environmental Laboratory
Whether La Niña actually brings colder weather also depends on many other factors (e.g., the North Atlantic Oscillation, Arctic Oscillation, and Indian Ocean Dipole) that can shape the outcome. Moreover, with ongoing climate change, the odds of truly severe winters are decreasing.
In this article, we examine what ENSO (El Niño/La Niña) is, how it operates, and its impact on seasonal weather patterns and climate in various parts of the world.
What is ENSO?
La Niña is part of the ocean–atmosphere circulation in the tropical Pacific known as the El Niño–Southern Oscillation (ENSO). ENSO is a manifestation of climate variability on time scales of months to years. It is characterized by changes in sea-surface temperature and associated shifts in the Walker circulation over the equatorial Pacific.
Weekly average sea surface temperature anomalies, November 2024–October 2025; NOAA Physical Sciences Laboratory
The Walker circulation is an east–west overturning of the atmosphere along the equator, which can be schematically described as follows: over the warmer part of the ocean, air rises (deep convection, lower pressure); in the upper troposphere it flows eastward (westerly flow); over the cooler part it descends (higher pressure); and near the surface the trade winds (easterlies) return westward, closing the zonal tropical circulation loop.
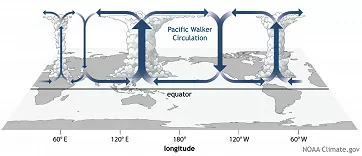
Generalized Walker Circulation (December-February) during ENSO-neutral conditions; NOAA Climate.gov
When the distribution of warm and cool water changes, the area of most intense convection shifts, the trade winds strengthen or weaken, and the pressure field across the Pacific is altered. This ocean–atmosphere coupling then influences seasonal weather patterns far beyond the Pacific.
The warm phase El Niño and the cool phase La Niña
ENSO fluctuates among three states: the warm El Niño, the cool La Niña, and neutral conditions.
The name “El Niño,” Spanish for “the little boy” (originally referring to the Christ Child), was adopted several centuries ago by fishermen in Peru and Ecuador for the unusually warm waters that reduced their catches just before Christmas.
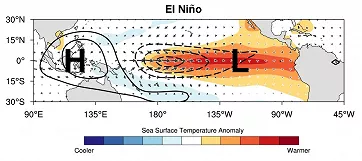
Schematic of wintertime conditions during El Niño: SST (shaded), surface winds (vectors), and sea-level pressure (H/L); NOAA Physical Sciences Laboratory
The counterpart to El Niño is La Niña, “the little girl”, which denotes a widespread cooling of sea-surface temperatures in the same region along with a reversal of the usual atmospheric conditions.
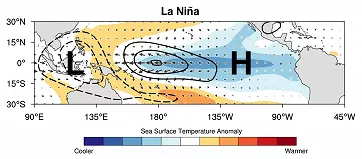
Schematic of wintertime conditions during La Niña: SST (shaded), surface winds (vectors), and sea-level pressure (H/L); NOAA Physical Sciences Laboratory
How the ocean and atmosphere work together
Let’s begin in the eastern tropical Pacific off the coasts of Peru and Ecuador, a region where fishermen have put to sea for generations. These waters are some of the planet’s most prosperous and most productive, both ecologically and for fisheries, due to the unique interaction between ocean and atmosphere.
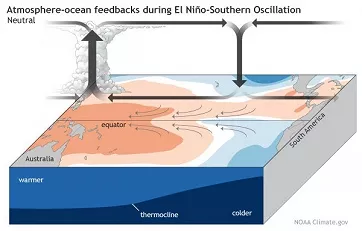
ENSO-neutral conditions across the tropical Pacific Ocean; NOAA Climate.gov
Along the equator under typical conditions, the trade winds blow from east to west. These winds push surface water away from the South American coast toward Indonesia. Hence, the mean sea level near Indonesia is approximately 1.5 feet (≈ 46 cm) higher than off the coast of Peru. Near Peru and Ecuador, surface water is displaced from the coast. The deficit is replenished by cold water, supplied from the south by the Humboldt (Peru) Current and from depth by coastal upwelling. Cold, nutrient-rich deep water reaches the surface more readily here because the thermocline (the boundary between warm surface water and the cooler water below) lies on average only about 30 m (≈ 100 ft) beneath the surface. Consequently, sea-surface temperatures near South America are about 8 °C (≈ 14 °F) lower than in the western Pacific.
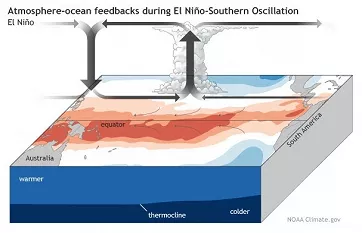
El Niño conditions across the tropical Pacific Ocean; NOAA Climate.gov
When El Niño begins, the equatorial trade winds weaken; in some areas, they may even briefly reverse. Warm surface water that normally pools in the western Pacific near Indonesia then shifts east, sharply warming the central and eastern tropical Pacific. With weaker trades no longer effectively pushing surface water away from the South American coast, coastal upwelling of cold, nutrient-rich deep water diminishes. At the same time, the thermocline in the eastern Pacific deepens, allowing the cold water to remain farther down and reach the surface less readily.
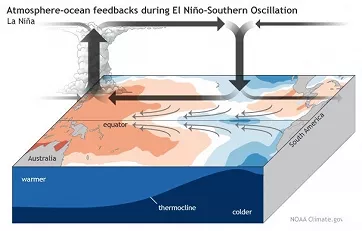
La Niña conditions across the tropical Pacific Ocean; NOAA Climate.gov
During La Niña, by contrast, the trade winds strengthen and more effectively draw surface water away from the coasts of Peru and Ecuador, as well as along the equator. This drives more vigorous coastal and equatorial upwelling, resulting in the central and eastern equatorial Pacific cooling below normal. At the same time, the thermocline’s depth changes: in the eastern Pacific, it shoals toward the surface, making it easier for cold water to reach the surface, whereas in the western Pacific, it deepens.
How ENSO is monitored
There are several methods for monitoring and evaluating ENSO to determine its current phase. To describe the state of ENSO, so-called indices are used; these condense a highly complex ocean–atmosphere phenomenon into a single numerical value.
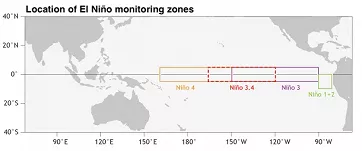
Locations of tropical Pacific regions used to monitor sea surface temperature; NOAA Climate.gov
The NOAA uses the Oceanic Niño Index (ONI) as its official indicator of ENSO. ONI is based on sea-surface temperature (SST) anomalies in the Niño 3.4 region of the central–eastern equatorial Pacific. These anomalies are computed relative to a 30-year rolling climatology and averaged into three-month running means. If those values remain at or above +0.5 °C (≈ +0.9 °F) or at or below −0.5 °C (≈ −0.9 °F) for at least five consecutive, overlapping three-month periods, NOAA classifies the episode as El Niño or La Niña.
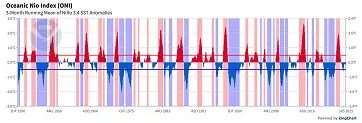
Oceanic Niño Index (ONI): 3-month running mean of Niño-3.4 SST anomaly; NOAA National Centers for Environmental Information
Some agencies use different thresholds. For example, the Australian Bureau of Meteorology applies a threshold of about ± 0.8 °C (≈ ±1.4 °F) and also requires evidence of an atmospheric response (e.g., trades, pressure). The basic principle is the same: it must be a sustained state of both the ocean and the atmosphere, not just a brief fluctuation.
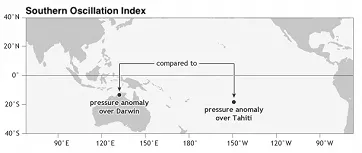
Locations of the Tahiti and Darwin stations used for the SOI; NOAA Climate.gov
The oldest indicator of ENSO is the Southern Oscillation Index (SOI). It is the standardized difference in sea-level pressure between Tahiti and Darwin, Australia. Fluctuations in pressure between these two locations capture the atmospheric component of ENSO (the Southern Oscillation), which was first described in the early 20th century. During El Niño episodes, the SOI tends to be negative because pressure over Tahiti is lower than usual, while over Darwin it is higher. Conversely, during La Niña, the SOI is typically positive, reflecting the opposite pressure pattern and stronger trade winds. A key advantage of the SOI is the availability of long station records (in some cases extending back to the late 19th century), which allows for the analysis of the relationship between ENSO and climate in a longer-term context.
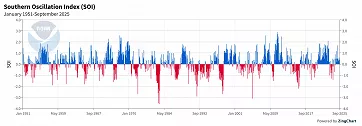
Southern Oscillation Index (SOI): standardized Tahiti–Darwin SLP difference; NOAA National Centers for Environmental Information
Conversely, one limitation of the SOI is that both Tahiti and Darwin lie south of the equator (Tahiti 18° S, Darwin 12° S), whereas ENSO itself is strongest right along the equator. For this reason, the Equatorial Southern Oscillation Index (EqSOI) is also used today. It is based on area-averaged sea-level pressure over two broad equatorial regions (from 5°S to 5°N): one centered over Indonesia and the other over the eastern equatorial Pacific. This index directly captures the atmospheric component of ENSO in the equatorial zone, but data for it are available only from approximately 1949 onward.
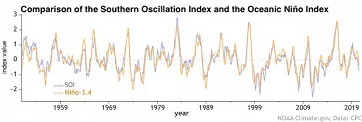
Comparison of ONI and SOI; NOAA Climate.gov
Sea-surface height is also a representative indicator of the ENSO phase and is monitored by satellites. During an El Niño episode, sea level in the eastern Pacific is above average, whereas during a La Niña episode, the enhanced upwelling of cold, deep water cools the surface layer, resulting in a decrease in sea level.
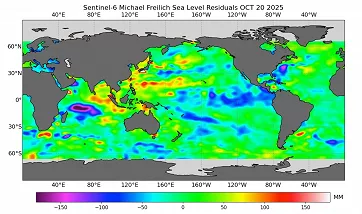
Sea surface height measured by satellite altimeters; NASA
Many other indices are also used to monitor ENSO (e.g., wind indices or outgoing longwave radiation indices). Taken together, they help describe the behavior of the complex, dynamic ocean-atmosphere interaction in the tropical Pacific.
Impacts of ENSO
ENSO is among the most crucial climate drivers on Earth. Although it originates in the tropical Pacific, its influence on large-scale circulation patterns (teleconnections) has far-reaching effects on seasonal weather patterns and climate across many regions of the world.
The distribution of warm surface water along the Pacific equator determines where evaporation and the release of heat and moisture to the atmosphere are most significant. Where the ocean is exceptionally warm, vigorous ascent and deep tropical convection develop. This strengthens the ascending branch of the Walker circulation, which in turn changes the pressure pattern over the Pacific and also influences the path of the jet stream in the upper levels of the atmosphere.
Typical impacts of El Niño (warm phase)
Warmer-than-normal water shifts into the central and eastern Pacific. This moves the atmosphere’s main “convective heat engine” eastward, along with the position of the Pacific jet stream. The result is that the winter storm track tends to lie farther south, delivering moist, heavy rainfall to the southern United States (California and the Gulf Coast). At the same time, the northern U.S. and Canada are more likely to experience warmer and drier conditions.
In the tropics, El Niño often brings extreme downpours and flooding to coastal Peru and Ecuador as unusually warm water arrives together with deep convection. By contrast, Australia, Indonesia, and parts of Southeast Asia tend to experience heatwaves and droughts, which can lead to water shortages and increased wildfire risk. Drought risk also increases in southern Africa and parts of Brazil, while southern South America (for example, Uruguay and southern Brazil) and certain regions of East Africa may experience above-normal rainfall.
El Niño often weakens the Indian summer monsoon (lower average rainfall and a higher risk of drought), but the relationship is not one-to-one; in some years, even with a drier seasonal mean, the likelihood of extreme local downpours in certain regions can increase.
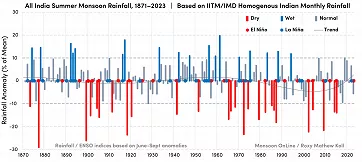
All-India Summer Monsoon Rainfall (1871–2023): drought +10% (dark blue); El Niño/La Niña during monsoon shown by red/blue dots; Climate Research Lab
Globally, El Niño typically nudges the planet’s average temperature upward, so strong El Niño years rank among the warmest on record (for example, 2023–2024 featured record heat, severe heatwaves, and widespread coral bleaching).
In the Atlantic, El Niño tends to suppress hurricane activity by increasing vertical wind shear over the tropical basin. The enhanced shear hinders storm intensification and, in years with moderate-to-strong El Niño, can reduce the number of hurricane days in the North Atlantic by around 60%. By contrast, the eastern and central Pacific often experience more active tropical cyclone seasons.
El Niño is generally associated with a weaker, less coherent polar vortex and a greater likelihood of disruptions.
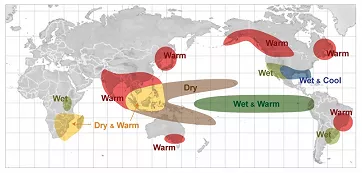
Typical El Niño impacts on global seasonal patterns (December–February); NOAA
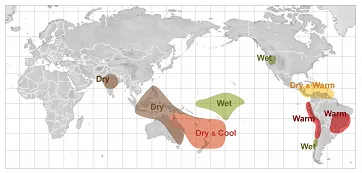
Typical El Niño impacts on global seasonal patterns (June–August); NOAA
Typical impacts of La Niña (cool phase)
La Niña essentially does the opposite: the trade winds strengthen, cold water rises to the surface in the eastern Pacific, and the warmest ocean waters remain near Indonesia and northern Australia. That concentrates ascending convective regions there, bringing heavier rains to Southeast Asia, Indonesia, and Australia. The flip side is drier conditions in parts of East Africa and along the eastern Pacific near the South American coast. In past strong La Niña years, Australia and Southeast Asia have experienced widespread flooding, while the Horn of Africa (Somalia, Ethiopia, eastern Kenya) has suffered extreme drought.
In North America, La Niña tends to shift the winter storm track farther north: the U.S. Pacific Northwest and western Canada are usually wetter and cooler, while the southern and southeastern United States tend to have drier and warmer winters. This is the opposite of El Niño.
La Niña is typically associated with a more active Atlantic hurricane season. The primary mechanism is reduced vertical wind shear over the tropical Atlantic during La Niña, which increases the likelihood that tropical storms organize and intensify into hurricanes. As a result, La Niña years often feature more and stronger Atlantic hurricanes, raising the risk of damage in the United States, the Caribbean, and the Gulf of Mexico.
La Niña generally has a cooling effect on the global mean temperature. In today’s warming climate, however, even La Niña episodes do not return temperatures to the “cool” levels of past decades; recent observations show that most of the world remains above the long-term average even during La Niña.
La Niña is often linked to a stronger, more coherent polar vortex; there are exceptions, though. In some winters, a sudden stratospheric warming (SSW) disrupts the vortex, followed by widespread cold-air outbreaks. For example, in 2017/18, the so-called “Beast from the East” brought Arctic air into Europe from the northeast.
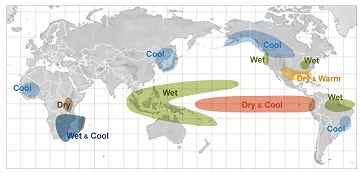
Typical La Niña impacts on global seasonal patterns (December–February); NOAA
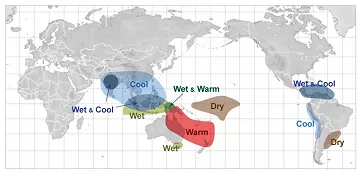
Typical La Niña impacts on global seasonal patterns (June–August); NOAA
Each ENSO episode is unique; El Niño and La Niña never unfold the same way. Their impacts on seasonal weather depend on several variables, including the intensity of the episode, the spatial pattern of temperature anomalies across the Pacific, the time of year, and interactions with other major climate modes (for example, conditions in the Indian Ocean or circulation patterns over the Atlantic).
ENSO is also unfolding against the backdrop of ongoing climate change, with the global mean temperature rising. Classic teleconnections (for example, “El Niño = a drier Indian monsoon”) may still occur, but record warm oceans and the increased water vapor content of the atmosphere can modify them.
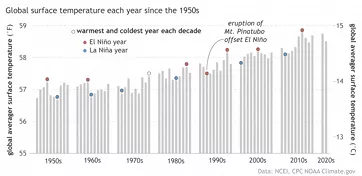
Global surface temperature: Warmest and coldest years per decade marked with circles: red for El Niño, blue for La Niña; NOAA Climate.gov
The role of ENSO in seasonal outlooks
On monthly to seasonal timescales, ENSO is among the most predictable components of the climate system. Changes in sea-surface temperature in the tropical Pacific are translated, with a lag of several months, into distinct patterns of precipitation, pressure, and temperature in various parts of the world. Therefore, ENSO phases are routinely used in seasonal forecasts and serve as a tool for meteorologists and climatologists to estimate the probabilities of departures from normal conditions (e.g., drier/wetter, warmer/cooler conditions, or changes in thunderstorm activity).
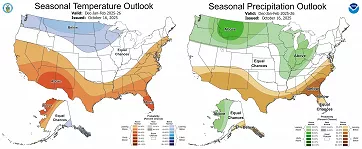
U.S. Seasonal temperature and precipitation Outlook (December 2025–February 2026); NOAA Climate Prediction Center
The Climate Prediction Center (CPC), part of the U.S. National Oceanic and Atmospheric Administration (NOAA), regularly issues ENSO analyses and outlooks, tracks indicators such as Pacific SST, and incorporates them into precipitation and temperature forecasts.
The India Meteorological Department (IMD) monitors SST in the Pacific and Indian Oceans as part of its models for predicting the onset and intensity of the summer southwest monsoon.
Australia’s Bureau of Meteorology (BoM) monitors ENSO alongside other indicators, such as the Indian Ocean Dipole (IOD), because these phenomena influence Australian rainfall, monsoons, and temperatures.
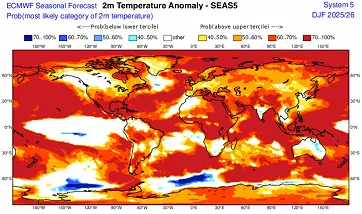
ECMWF seasonal forecast (SEAS5): probabilities of 2 m air temperature anomalies for December 2025–February 2026 (51-member ensemble; horizontal resolution ≈ 36 km); ECMWF
Windy is a weather expert
Windy is designed to display weather, particularly current conditions and short- to medium-range forecasts. While you won’t find climate phenomena such as ENSO, which rely on long-term datasets, directly in Windy, you can track their current signals in the atmosphere and ocean: sea surface temperature, trade winds, cloud and convection patterns, and the pressure field over the Pacific.
Information on the state of the climate, specific climate phenomena, and long-term climate outlooks is provided by specialized sources, including the WMO Global Seasonal Climate Update, NOAA’s Climate Prediction Center (CPC), and ECMWF/Copernicus C3S.
Comments (6)