
Richmond
Washington
Harrisburg
New York
North Carolina
Raleigh
Bridgetown
Roseau
St. John's
Road Town
Lesser Antilles
Holguín
Kingston
Port-au-Prince
Caribbean Sea
Dominican Republic
Mérida
Managua
Honduras
Belmopan
Bilwi
Nicaragua
George Town
Cancún
Cuba
Acapulco
Mexico City
Tuxtla Gutiérrez
Guatemala
Guatemala City
Guadalajara
Bahamas
Nassau
Monterrey
Ciudad Victoria
Baton Rouge
Louisiana
Austin
Texas
Miami
Florida
Tallahassee
Gulf of Mexico
Havana
Hamilton
Virginia
Ohio
Kentucky
Tennessee
Indiana
Alabama
Georgia
Montgomery
Mississippi
Illinois
Nashville
Indianapolis
Springfield
Frankfort
Charleston
Columbia
Columbus
Atlanta
Jackson
Arkansas
Oklahoma
Missouri
Kansas
Dallas
Jefferson City
Little Rock
Oklahoma City
Topeka
United States
Lincoln
Lamar
Amarillo
New Mexico
Santa Fe
Lubbock
Gallup
Utah
Phoenix
Arizona
Colorado
Denver
Salt Lake City
New Brunswick
Halifax
Nova Scotia
Fredericton
Charlottetown
Gulf of Saint Lawrence
Newfoundland
Maine
Quebec
Saguenay
Montpelier
Albany
Ottawa
Lake Ontario
Augusta
Boston
New York
Pennsylvania
Iowa
Fargo
Hibbing
Bismarck
North Dakota
Minnesota
Saint Paul
Des Moines
Nebraska
Pierre
South Dakota
Sudbury
Toronto
Lake Erie
Michigan
Lansing
Wisconsin
Rouyn-Noranda
Lake Michigan
Lake Huron
Wawa
Marquette
Lake Superior
Thunder Bay
Madison
Cheyenne
Wyoming
Havre
Williston
Billings
Montana
Afton
Rapid City
Helena
Mexico
Culiacán
Chihuahua City
Ciudad Juárez
La Paz
Hermosillo
© OpenStreetMap contributors
Sunday 26
  • 03
  • 06
  • 09
  • 12
  • 03
  • 06
  • 09
Monday 27
  • 03
  • 06
  • 09
  • 12
  • 03
  • 06
  • 09
Tuesday 28
  • 03
  • 06
  • 09
  • 12
  • 03
  • 06
  • 09
Wednesday 29
  • 03
  • 06
  • 09
  • 12
  • 03
  • 06
  • 09
Thursday 30
  • 03
  • 06
  • 09
  • 12
  • 03
  • 06
  • 09
Friday 31
  • 03
  • 06
  • 09
  • 12
  • 03
  • 06
  • 09
Saturday 1
  • 03
  • 06
  • 09
  • 12
  • 03
  • 06
  • 09
Sunday 2
  • 03
  • 06
  • 09
  • 12
  • 03
  • 06
  • 09
Monday 3
  • 03
  • 06
  • 09
  • 12
  • 03
  • 06
  • 09
Tuesday 4
  • 03
  • 06
  • 09
  • 12
  • 03
  • 06
  • 09
Wednesday 5
  • 03
  • 06
  • 09
  • 12
  • 03
  • 06
  • 09
Thursday 6
  • 03
  • 06
  • 09
  • 12
  • 03
  • 06
  • 09
Friday 7
  • 03
  • 06
  • 09
  • 12
  • 03
  • 06
  • 09
Saturday 8
  • 03
  • 06
  • 09
  • 12
  • 03
  • 06
  • 09
Sunday 9
  • 03
  • 06
  • 09
  • 12
  • 03
  • 06
  • 09
3 PM
Go Premium
kt051020304060
Developed with
Download App
Multimodel Approach to Weather Forecasting: Predictability and Probability
Jari Sochorová
-
updated 4 days ago
436
17 Comments
...

Imagine you’re planning an outdoor event. The forecast says: “On Wednesday, temperatures will reach 25 °C, with cloudy skies and no precipitation.” Sounds perfect. But can you really be sure it won’t rain?
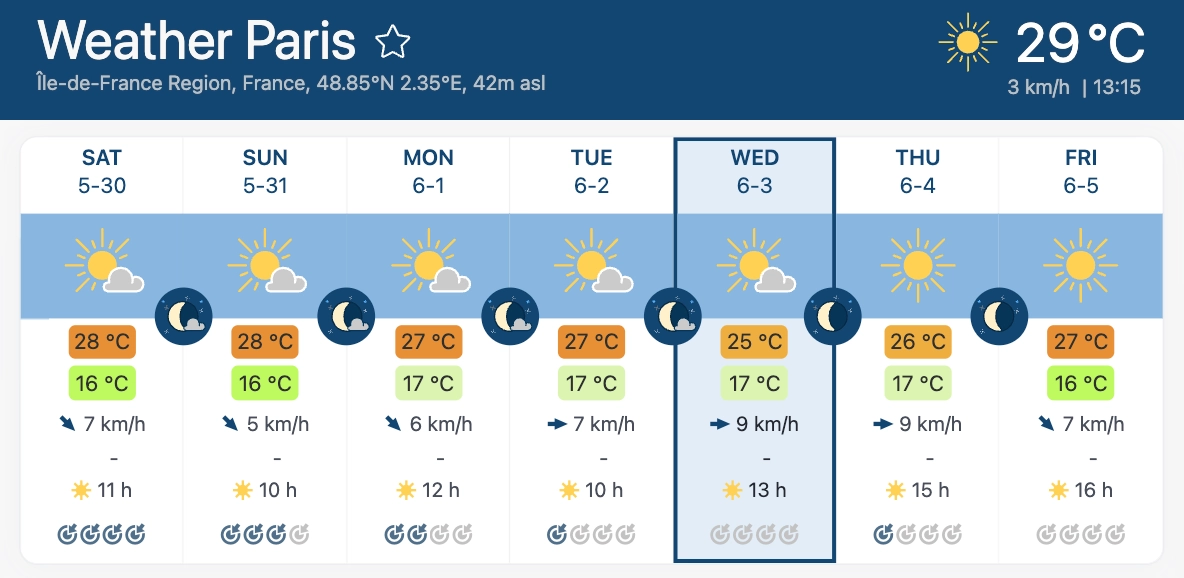
Weather forecast for Paris; meteoblue

The answer becomes clearer once you add one key piece of information: predictability. The forecast itself may not change, but the decision you make based on it certainly can.

With the meteoblue Learning MultiModel (mLM), Windy.com now shows forecast predictability for a specific location, giving you a quick sense of how reliable the forecast is.

Since version 51, predictability will be shown on Windy.com in the point forecast as coloured dots next to each day: green means the forecast is reliable; orange and red indicate increasing uncertainty; and burgundy means the forecast is likely to change

In the following sections, we’ll explain what predictability means, how it is derived, and why multimodel forecasts can provide a more reliable picture of the weather.

Forecast predictability

Forecast predictability describes how confidently we can estimate the future evolution of the weather and how far in advance such a forecast remains meaningful.

Forecast predictability is limited both by the inherent nature of the atmosphere and by our ability to accurately describe and model its behavior.

The atmosphere is a dynamic, nonlinear system in which even very small differences in initial conditions can gradually lead to significantly different outcomes. This property, known as deterministic chaos, fundamentally limits our ability to forecast the weather.


The Lorenz system illustrates the chaotic nature of the atmosphere: tiny differences in the initial state can lead to very different outcomes as the forecast progresses; T. N. Palmer

In addition, a number of unavoidable errors arise when numerically modelling the future state of the atmosphere. These are related to both the simplification of complex physical processes in models and their limited resolution, as well as to the fact that initial conditions are never known perfectly, since they are based on a limited number of observations.

Diagram showing how the Earth’s surface and atmosphere are divided into a grid. In each cell, the model solves physical equations and represents smaller processes using parameterizations; AGI via structures.uni-heidelberg.de

Approaches to predictability

Predictability can be expressed in various ways. In practice, ensemble forecasts and multimodel approaches are most commonly used.

Ensemble forecasts

Ensemble forecasts aim to capture the sensitivity of a forecast to atmospheric initial conditions. They are based on multiple runs of a single numerical model, each executed with slightly different initial conditions and configurations. These small intentional changes are called perturbations.
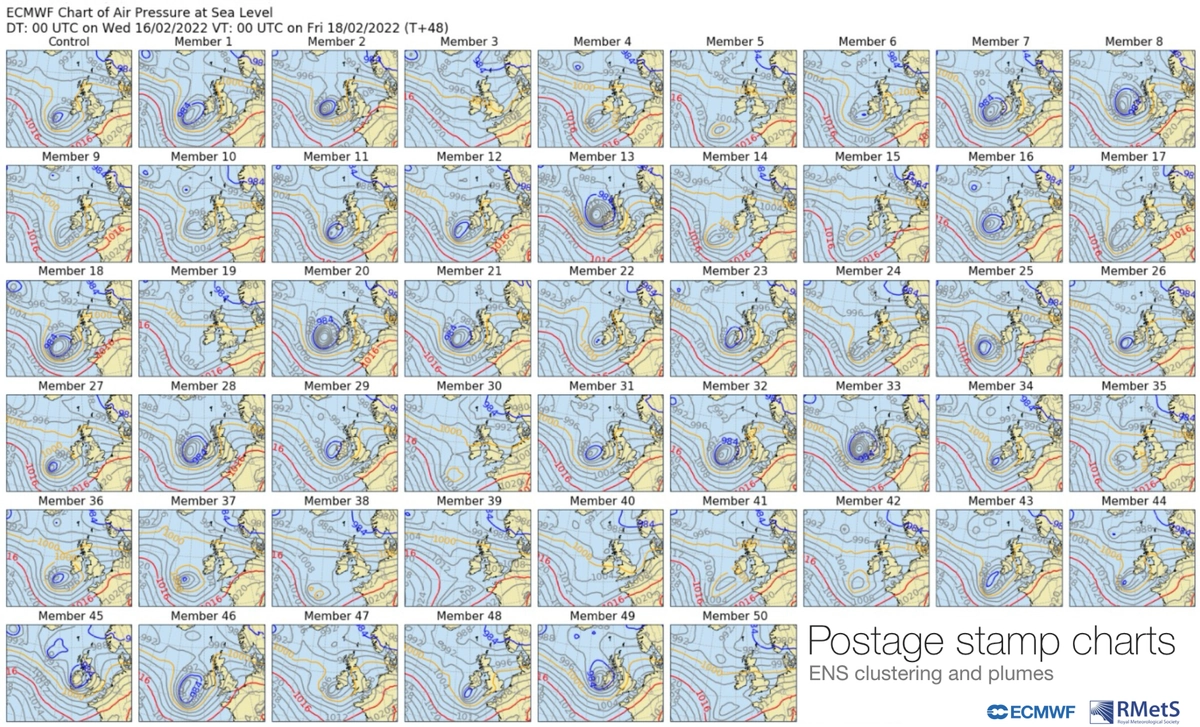
ECMWF ensemble forecast: 50 members and the control run; RMetS

For example, the European Centre for Medium-Range Weather Forecasts (ECMWF) runs an ensemble forecasting system consisting of one unperturbed control forecast and 50 perturbed members. Together, they represent a range of possible scenarios for the future evolution of the atmosphere.
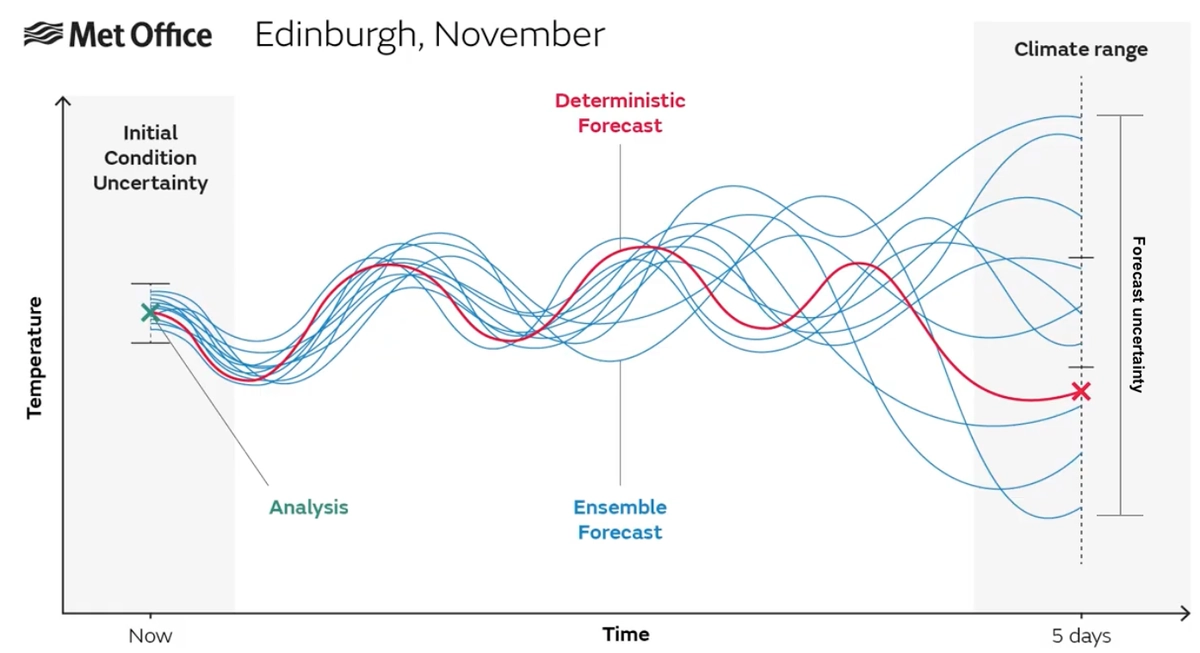
A schematic representation of an ensemble forecast, showing how small differences in initial conditions can grow into large forecast differences over time; Met Office via RMetS

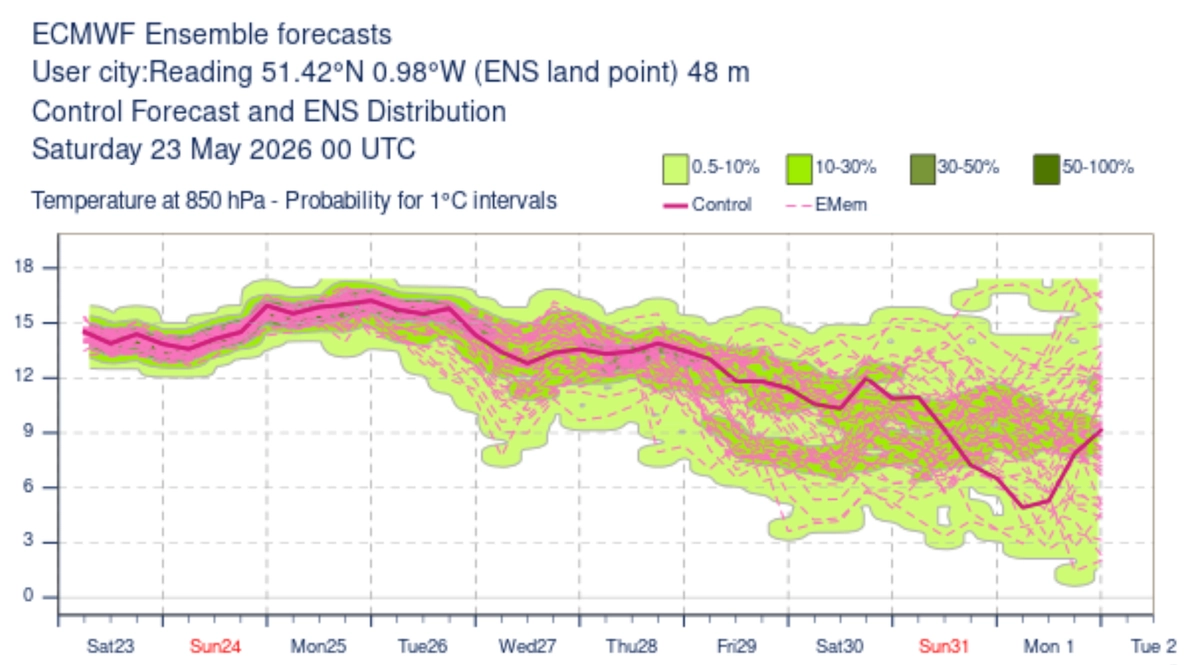
The level of agreement among these scenarios provides information about forecast reliability and allows estimation of the probability of specific weather events. Strong agreement among most members usually indicates higher forecast reliability, while large differences between members often point to a more complex and less predictable meteorological situation.

ECMWF ensemble forecast of 850 hPa temperature for Reading; ECMWF

Multimodel approach

A multimodel approach combines outputs from several different numerical models. As with ensemble forecasts, comparing outputs from individual models allows us to estimate both the likely evolution of the weather and the forecast uncertainty.

While ensemble forecasts are part of the numerical prediction process itself, multimodel approaches are applied later in the post-processing stage.

Multimodelling technique

At a basic level, the multimodel approach can be compared to the work of an experienced meteorologist. A multimodel system considers several available model outputs and, based on past performance, evaluates which models are most reliable in a given situation. For example, it can take into account how individual models perform in a particular region or under specific weather conditions.

National Severe Storms Laboratory; NSSL NOAA 

Like a forecaster, it may then give more weight to one model or combine several model outputs into a final forecast. Modern multimodel systems do this automatically using statistical methods and, increasingly, artificial intelligence (AI) and machine learning.

Comparison of model outputs with observed weather on Windy.com

Advantages of multimodelling

A multimodel approach leverages the strengths of multiple numerical models while reducing their individual errors.

Each model uses slightly different physical formulations, parameterizations, resolutions, and input data, and therefore their performance may vary depending on the specific situation. When their outputs are properly combined and statistically adjusted, the resulting forecast is often more stable and accurate than that of a single model.

Modern multimodel systems also enable automatic evaluation of individual model performance, dynamic weighting, bias correction, and the generation of probabilistic forecasts. This is why multimodel approaches are increasingly used in modern meteorology and weather applications.
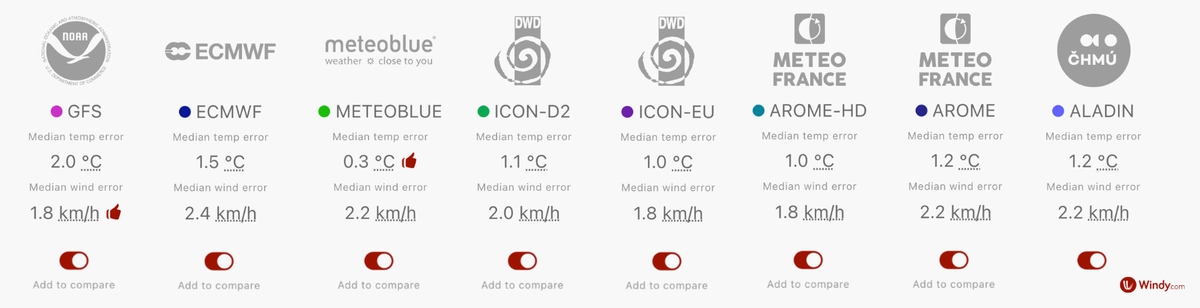
Comparison of model outputs with observed weather on Windy.com

Modern multimodel systems and machine learning

Modern multimodel systems increasingly rely on artificial intelligence methods, particularly machine learning. Their main goal is to improve the final forecast by learning from large amounts of historical data.

Using extensive archives of meteorological observations, reanalyses (e.g., ERA5), and numerical model outputs, machine learning algorithms learn relationships between atmospheric variables and the resulting forecast.

Machine learning systems learn from historical data:

  • which models tend to be the most reliable in specific situations,
  • what systematic errors individual models typically make,
  • how these errors vary depending on region, season, or type of weather.
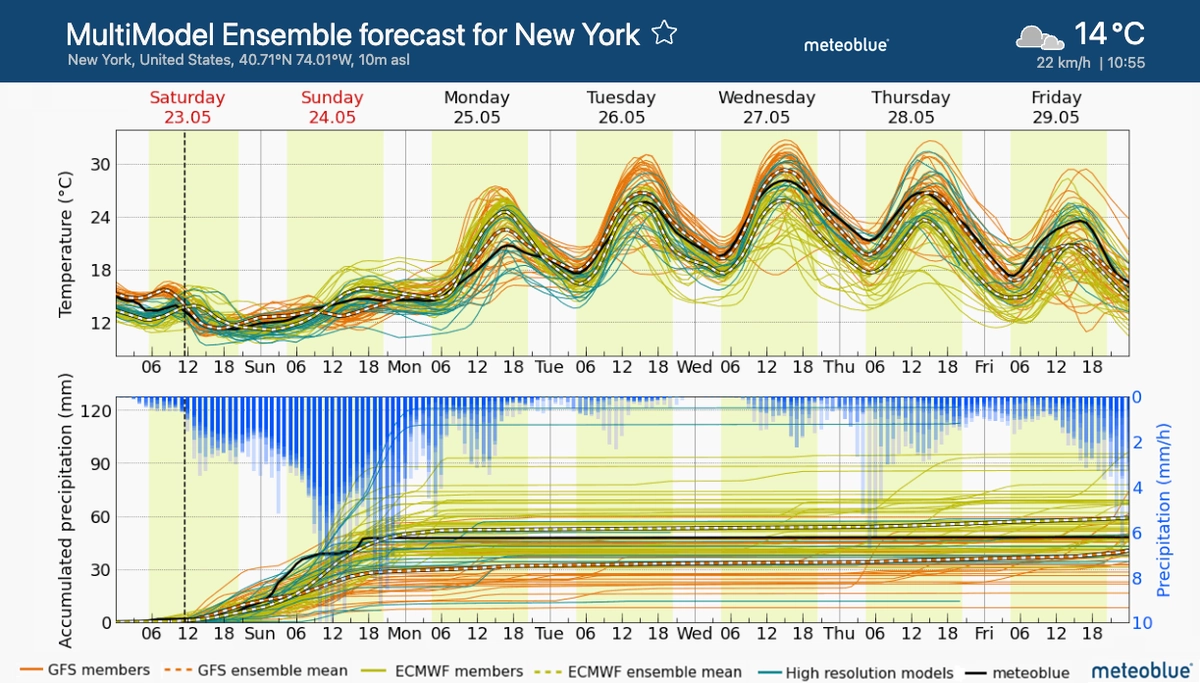
Multimodel ensemble forecast; meteoblue

How modern multimodel forecasts are created

Modern multimodel systems using machine learning typically operate in two main phases: training and operational forecasting.

Training phase

During the training phase, a machine learning system works with large amounts of historical data. It uses archived numerical model forecasts, ensemble forecasts, radar and satellite data, weather station observations, and reanalyses such as ERA5 from the Copernicus Climate Change Service (C3S), operated by ECMWF.
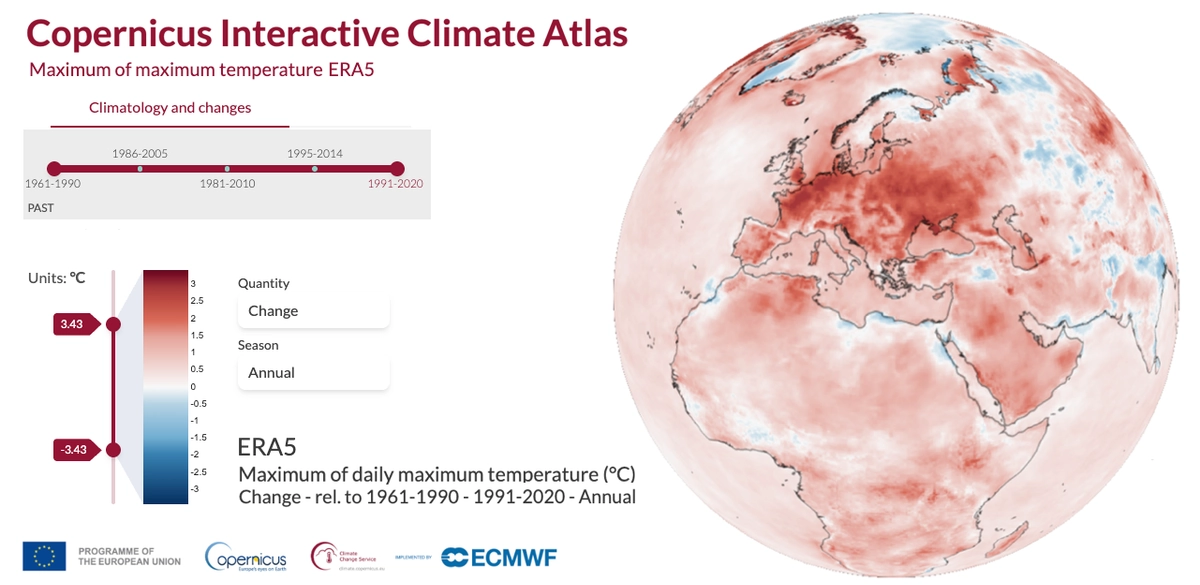
Historical climate data from the Copernicus Climate Change Service (C3S); Copernicus Climate Atlas 

This allows the system to compare past model predictions with actual observed weather.

From these historical comparisons, it learns to recognize the typical characteristics of individual models as well as their systematic errors, such as the long-term overestimation of precipitation.

Based on this experience, a statistical model is built to automatically determine which models are likely to perform best in a given forecasting situation.
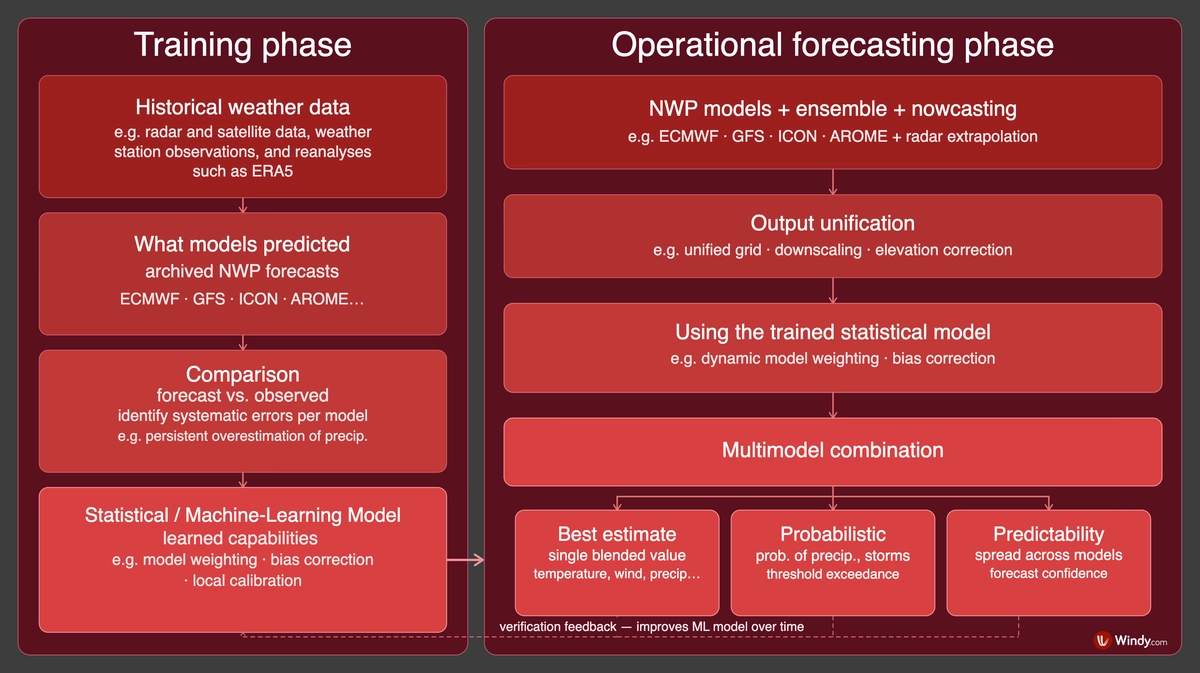
The system can dynamically adjust model weights, perform bias correction, and refine the forecast for a specific location.

This is followed by the operational forecasting phase.

A schematic example of multimodel processing

Operational multimodel forecasting

The system first collects outputs from various numerical models, both global and regional. Some multimodel systems also use individual ensemble forecast members, for example from ECMWF or GFS.

Outputs from individual models are interpolated onto a unified grid and then statistically adjusted to improve comparability and better reflect local conditions. Methods such as downscaling, elevation correction, and local calibration are used for this purpose.

Based on a statistical model trained on historical data, weights are assigned to individual models and dynamically adjusted according to the current situation.
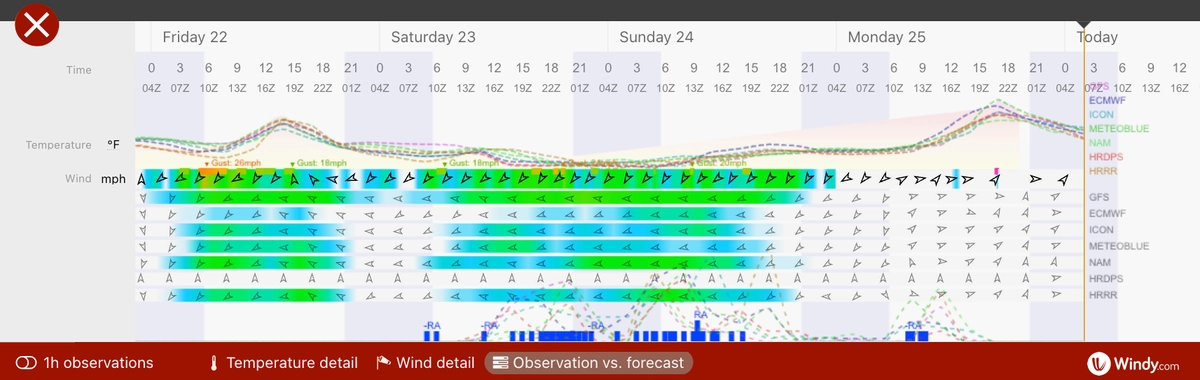
Model outputs vs. observed weather on Windy.com

At the same time, systematic errors in individual models identified during the training phase are corrected.

The individual model outputs are then combined into a final forecast (guidance). The result may be either a single value of the predicted parameter or a probabilistic forecast (for example, the probability of precipitation, thunderstorms, or exceeding a certain temperature threshold), along with information about predictability.

Some modern multimodel systems also incorporate nowcasting.

Nowcasting

Nowcasting refers to very short-term weather forecasting, typically covering a time horizon from tens of minutes up to a few hours. 

It is primarily based on current observations, especially radar and satellite data, and tracks the actual evolution of the atmosphere in real time. Unlike numerical models, which compute the future state of the atmosphere using physical equations, nowcasting often relies on extrapolating the current state, for example the movement of precipitation or thunderstorms.

Radar nowcasting is mainly based on extrapolating the recent movement of precipitation areas from radar imagery

In a multimodel approach, nowcasting complements traditional numerical models. It helps bridge the current state of the atmosphere and model forecasts, refining the short-term forecast especially when rapidly evolving phenomena such as showers or thunderstorms are not accurately captured by the models.
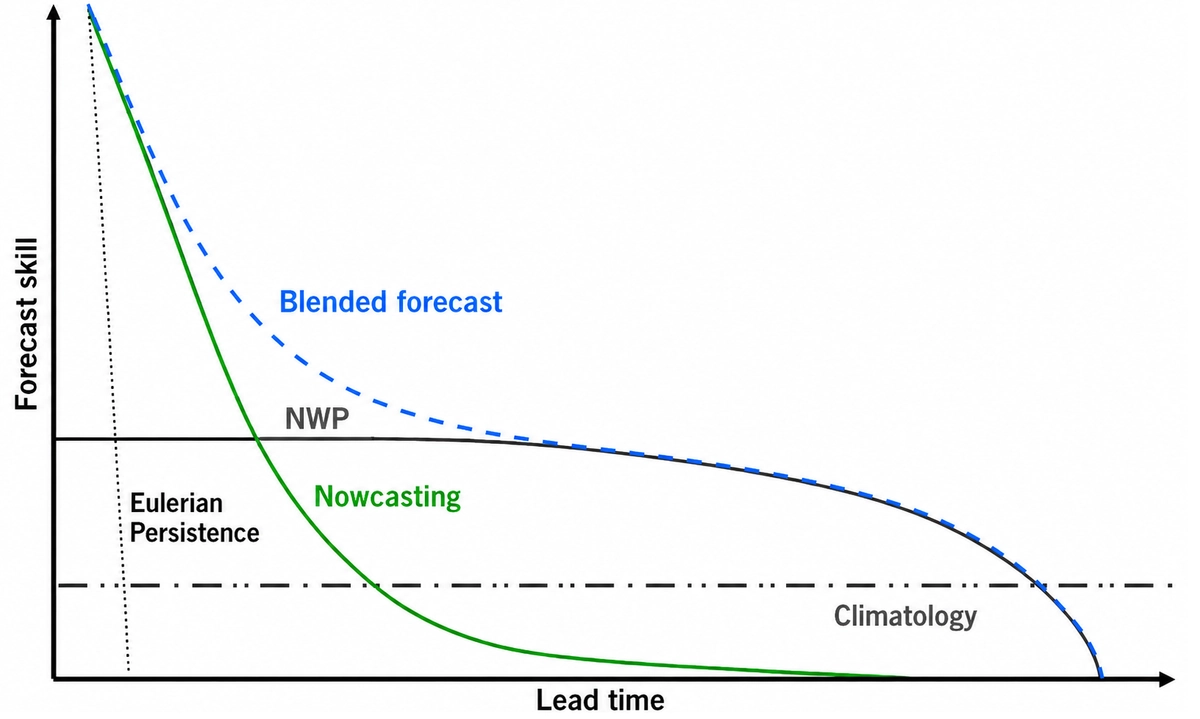

Forecast skill as a function of lead time for different forecasting methods. A blended forecast combines different forecasting approaches, such as nowcasting and numerical weather prediction. This highly simplified schematic shows forecast skill qualitatively and not to scale; RMetS

Modern weather forecasting is thus shifting from interpreting individual model outputs toward the comprehensive integration of multiple data sources and advanced processing methods. At the same time, this approach remains strongly dependent on data generated by physical models.

meteoblue Learning MultiModel on Windy.com

In the Windy.com point forecast for a specific location, you can view not only the outputs of individual numerical weather models but also a multimodel forecast. This forecast is developed by the Swiss weather company meteoblue, which has been closely connected with Windy.com since 2024.

The multimodel is called the meteoblue Learning MultiModel (mLM), but on Windy.com it is available as meteoblue AI.

mLM uses advanced post-processing methods, including statistical techniques and machine learning, to improve the outputs of numerical weather prediction models. Depending on the location, it combines the outputs of approximately 30 to 40 models with current observations from weather stations, radar, and other sources.

For each forecast parameter, mLM calculates a new value using weights and corrections derived during training on a large historical dataset. Through this training process, the system learns which models are most reliable for a given location, parameter, and weather conditions.

mLM produces forecasts for a wide range of meteorological parameters. On Windy.com, we display air temperature and dew point temperature at 2 metres, cloud cover, precipitation and precipitation type, wind speed and gusts, as well as forecast predictability. meteoblue also provides additional parameters, such as solar radiation and wind at turbine hub height.

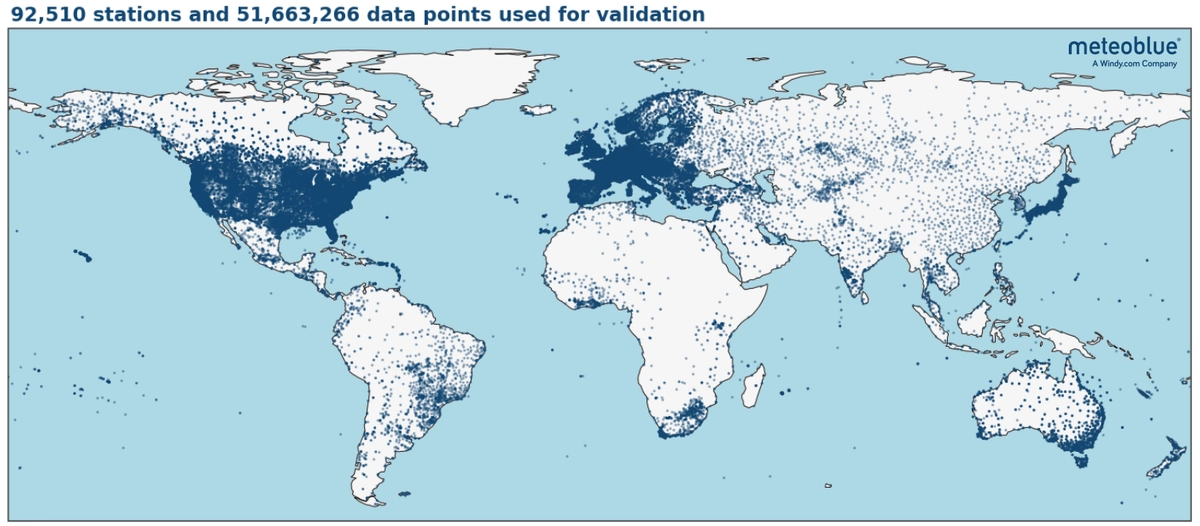
Measurements from around 100,000 weather stations worldwide are used to verify mLM forecasts. However, only approximately 60% of them meet the strict quality-control criteria. This rigorous selection process produces a reliable reference dataset that reflects the observed weather conditions; meteoblue

meteoblue continuously assesses the quality of its forecasts through rigorous monthly verification. meteoblue compares mLM forecasts with observations from more than 30,000 weather stations worldwide.

Forecasts from the following major global models are verified in the same way: IFS and AIFS (ECMWF), GFS (NOAA), NEMSGLOBAL (NOAA and meteoblue), ICON (DWD), ARPEGE (Météo-France), the UK Met Office global model, and GEM (Environment and Climate Change Canada). The performance of the individual models is then compared.

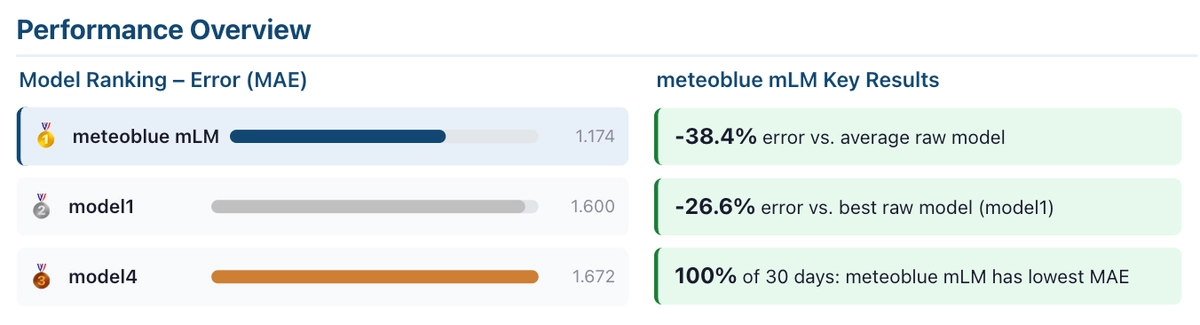
Temperature verification for June 2026: Performance overview of mLM. MAE stands for mean absolute error and indicates the average difference between the forecast and the observed temperature. Lower values indicate greater forecast accuracy; meteoblue

According to the verification results, mLM achieves high accuracy and has the lowest error rate among the models compared.

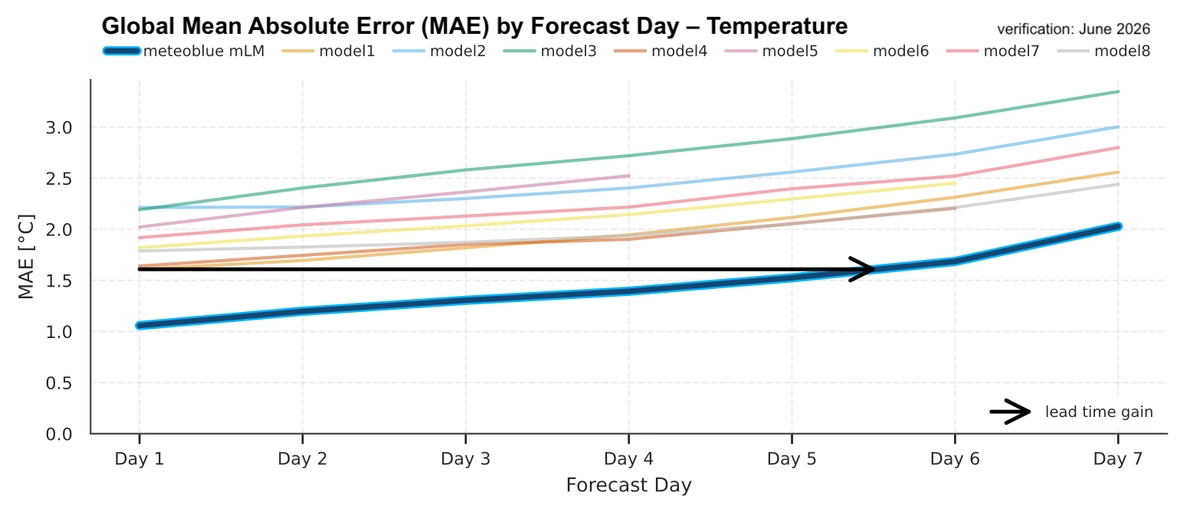
For both air temperature and dew point, the mLM forecast remains as accurate on days 4 and 5 as the one-day forecast from the best-performing individual model. For wind speed, mLM maintains comparable accuracy even on forecast day 7.

Temperature verification for June 2026. The black arrow illustrates the lead-time gain: the mLM forecast for day 5 is as accurate as the best raw model forecast for day 1; meteoblue

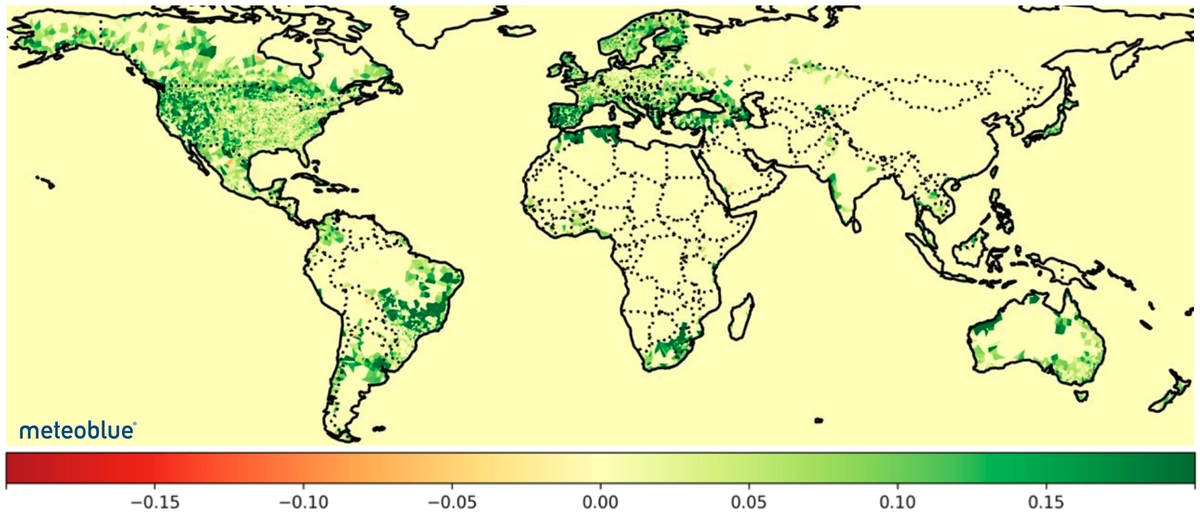
In addition, a 2025 precipitation study showed that forecast accuracy improved by more than 20% compared with forecasts based on a single model's output.

Day 1 skill score improvement of meteoblue mLM relative to ECMWF IFS (calculated as the skill score difference); meteoblue

Long-term statistical results show that mLM / meteoblue AI is among the most accurate forecasts available on Windy.com.

Finally, it is important to note that meteoblue AI is available only as a point forecast for a specific location and cannot be displayed as a continuous layer on the map. This is because the calculation is tailored to each location, is performed in real time, and combines numerical model outputs with a range of other available data on current weather conditions.

436 claps

Comments (17)