

In early June 2025, people across many parts of Western and Central Europe enjoyed several days of beautifully colored sunrises and sunsets. This stunning display was linked to smoke from massive wildfires burning more than 6,000 kilometers (3,700 miles) away in central Canada.

Colorful sunset over Bibury, Gloucestershire, England (31 May 2025); Ed Robinson
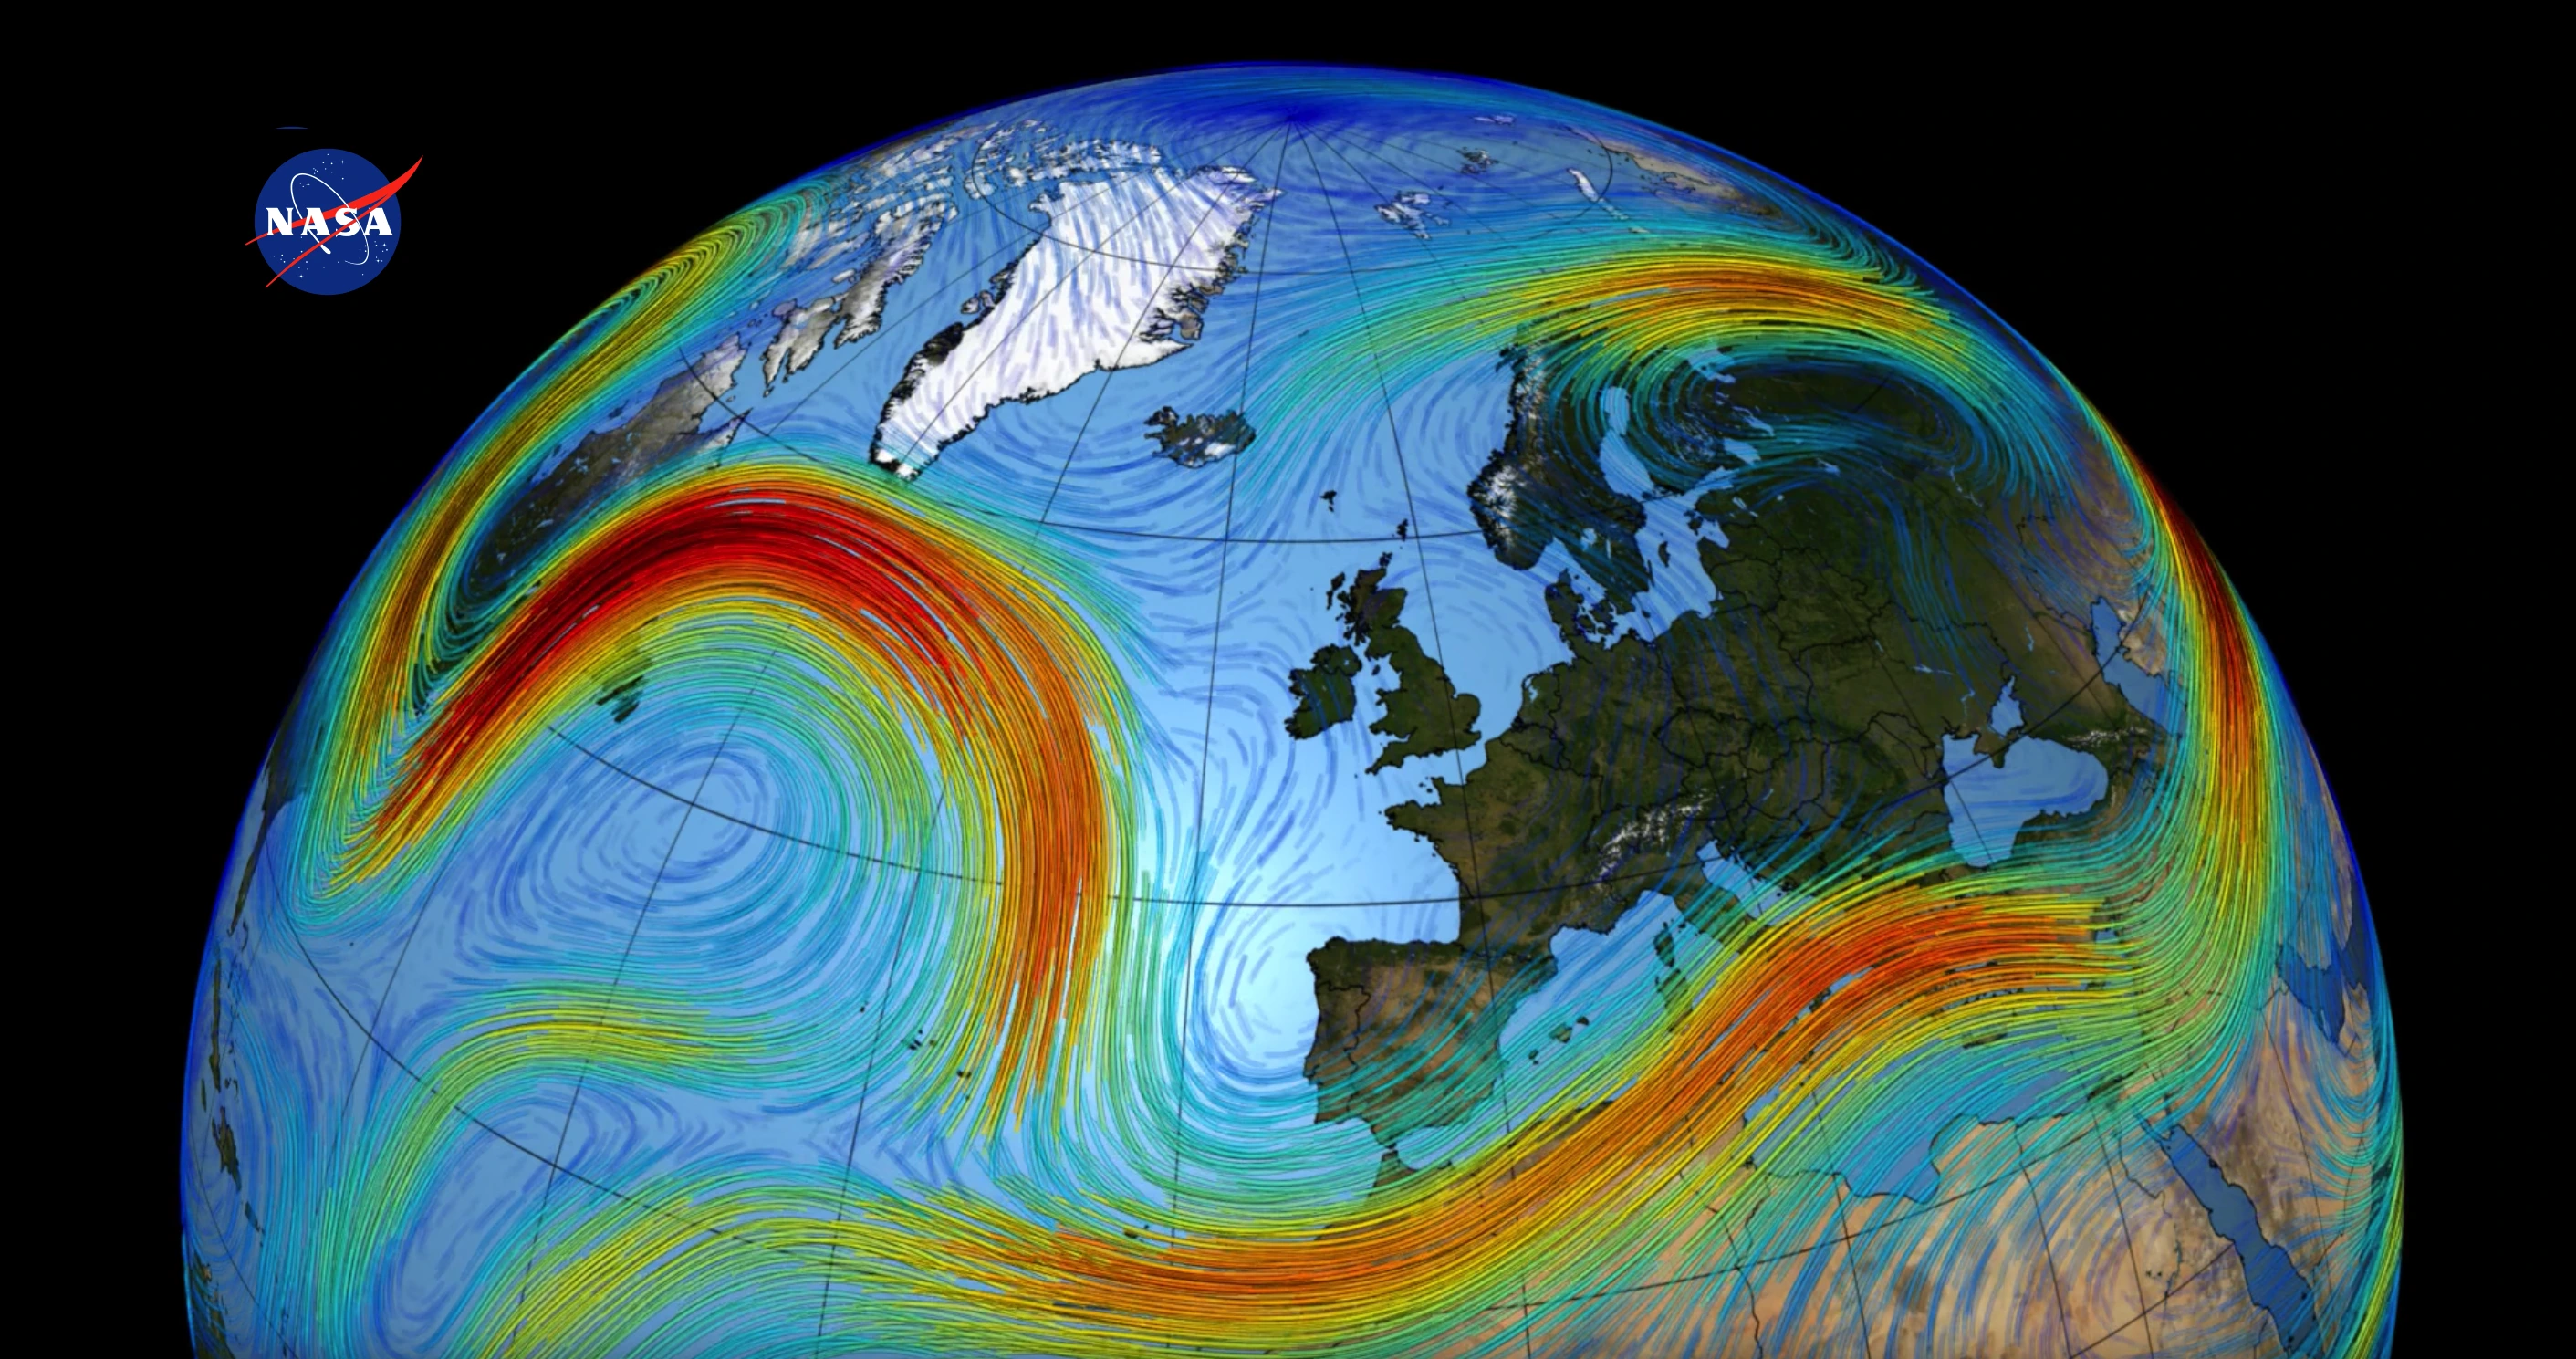
How is it possible that smoke particles could travel such a vast distance across the entire Atlantic? The key to this long-range transport lies high up in the atmosphere, in a region known as the jet stream. This powerful high-altitude wind can carry fine particles thousands of kilometers across continents and oceans.
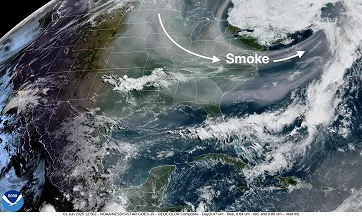
Smoke from Canadian wildfires captured in a GOES-19 satellite image (1 June 2025); NOAA
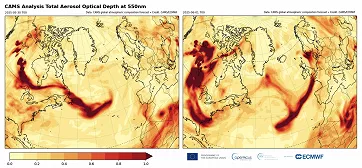
CAMS total aerosol optical depth analysis over the North Atlantic (30 May and 1 June 2025); CAMS
What is the jet stream?
The jet stream is a relatively narrow band of very strong winds, typically blowing from west to east. Its shape is often compared to that of a flattened tube with an approximately horizontal axis, stretching for thousands of kilometers, while its diameter is usually only a few hundred kilometers. It is located in the upper layers of the troposphere, often 1 to 2 kilometers below its upper boundary, known as the tropopause. This corresponds to an altitude of roughly 6 to 13 kilometers (about 4 to 8 miles) above the Earth's surface.
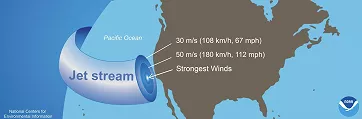
The jet stream can be imagined as a flattened tube with a nearly horizontal axis; NOAA (slightly modified)
According to some definitions, a jet stream is classified as airflow with a speed of at least 30 m/s (approximately 108 km/h or 67 mph). Jet streams commonly reach speeds of around 180 km/h (50 m/s, 112 mph), but in extreme cases can exceed 400 km/h (122 m/s, 273 mph).
The history of jet stream discovery
One of the earliest discoverers of the jet stream is often considered to be the Japanese meteorologist Wasaburo Ooishi, who in the 1920s used weather balloons to study upper-level air currents.
The term jet stream first appeared in 1939, in a scientific paper by German meteorologist Heinrich Seilkopf, who used the term Strahlströmung, meaning “beam flow”.
The intensive use of aircraft during World War II greatly expanded knowledge of upper-level air flow and atmospheric dynamics in the higher layers of the troposphere.

The Institute of Meteorology, Class of 1940–41 (C. G. Rossby: 3rd row, 5th from left), Portrait of meteorologist Carl-Gustaf Rossby; American Meteorological Society/Library of Congress
A significant contribution to understanding the origin and dynamics of the jet stream came from Swedish-American meteorologist Carl-Gustaf Rossby (1898–1957). He was one of the founding figures of the so-called Chicago School of Dynamic Meteorology, a group of scientists who, during the 1940s and 1950s, worked at the University of Chicago and studied the principles of general atmospheric circulation. Their research played a fundamental role in establishing the theoretical and physical foundations on which modern numerical weather prediction was later built.
Why do jet streams form?
Because of two essential ingredients: heating and rotation.
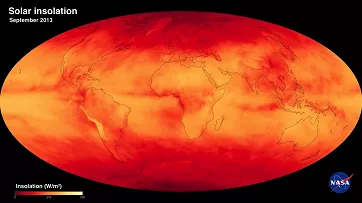
Average solar insolation in September 2013; NASA
The Sun does not heat the Earth evenly. Areas near the equator receive more solar radiation and warm up more than regions near the poles. When warm air masses meet cold ones, the warm air rises into higher layers of the atmosphere, while the colder air moves in to replace it from below. This movement creates air flow, in other words, wind.
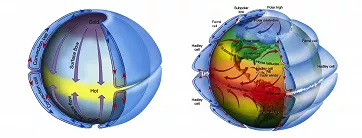
Global atmospheric circulation: without Earth’s rotation (left), with rotation (right); Eastern Illinois University via Royal Meteorological Society
If the Earth did not rotate, the rising warm air from equatorial regions would flow directly toward the poles in the upper troposphere. However, because the Earth rotates, the Coriolis force deflects this air flow, to the right in the Northern Hemisphere and to the left in the Southern Hemisphere. As a result of this uneven heating and the planet’s rotation, three distinct circulation cells form in each hemisphere: the Hadley cell, the Ferrel cell, and the polar cell.
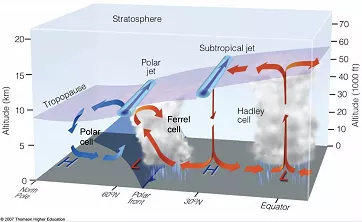
Cross section of the Northern Hemisphere showing jet streams and tropopause elevations; Atmospheric Sciences at Northern Vermont University
This three-cell atmospheric circulation system causes air masses with very different temperatures to meet in zones around 30° and 50°–60° latitude in both hemispheres. The greater the temperature difference, the stronger the resulting winds. These sharp horizontal temperature contrasts lead to the formation of intense high-altitude air currents, the so-called jet streams.
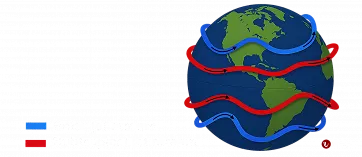
Jet stream distribution schematic; Windy.com
The subtropical jet stream occurs around 30° latitude, while the polar jet stream is found between 50° and 60°. The polar jet tends to be stronger than the subtropical jet due to the greater temperature contrast between cold polar air and warmer mid-latitude air, especially during winter, when the polar jet stream reaches its greatest strength.
The four main jet streams
In theory, jet streams encircle the Earth in four continuous bands: two polar and two subtropical. However, their actual shape and behavior result from a complex interplay of many factors, including the distribution of land and oceans and how differently they heat up, the position of pressure systems, seasonal variations in solar radiation reaching the Earth's surface, and more.
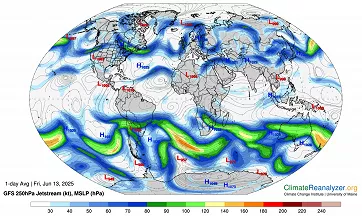
Jet Stream at 250 hPa (color) and Mean Sea Level Pressure (isolines), 14 June 2025; ClimateReanalyser.org
Jet streams meander, shifting in both altitude and latitude. At times, they split or merge, form eddies, and can even disappear entirely in one region or suddenly reappear in another.
Why care about something so high above us?
The jet stream has a direct impact on weather at the Earth’s surface in several important ways.
It steers the movement of pressure systems in the mid-latitudes, areas of high and low pressure, and therefore plays a key role in shaping surface weather.
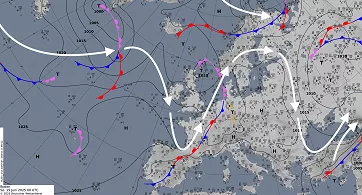
Synoptic weather map, approximate jet stream positions (white arrows); Deutscher Wetterdienst
When the jet stream is strong and relatively straight, weather patterns tend to shift quickly. But when it’s weak or highly meandering, the movement of pressure systems can become blocked, causing a particular weather pattern, such as prolonged rain or an extended dry spell, to persist for days.

Definition of a jet streak; NOAA
A very important part of the jet stream is a jet streak, the area where winds blow the strongest. A jet streak is associated with zones of rising and sinking air. In the Northern Hemisphere, rising motion typically occurs in the right entrance and left exit regions of a jet streak, where upper-level divergence leads to compensating vertical upward motion. In the Southern Hemisphere, upward motion tends to occur in the left entrance and right exit regions.
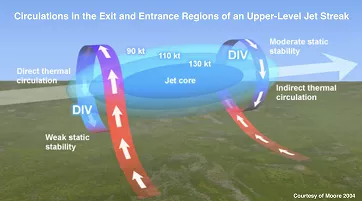
Schematic of the cross circulation at the jet entrance and exit regions; UCAR/COMET
In the Southern Hemisphere, upward motion tends to occur in the left rear and right front quadrants. These upward air motions associated with jet streaks significantly contribute to the development and intensification of low-pressure systems, and also influence the strength and organization of thunderstorm systems.
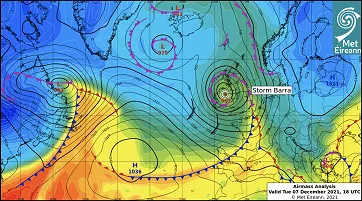
Storm Barra – Analysis chart (18 UTC), 7 December 2021; Met Éireann
A well-documented example of how a jet streak and its upward motion zones can trigger explosive cyclogenesis is Storm Barra (December 2021). As the low-pressure system entered the left exit region of a strong jet streak over the North Atlantic on December 6–7, its central pressure dropped rapidly by 55 hPa in 24 hours. Barra reached peak intensity just before landfall and struck Ireland on December 7–8 with widespread damaging winds, gusting up to 135 km/h.
How does the jet stream affect air travel?
Airplanes often fly at the same altitudes where jet streams are typically found. When flying in the same direction as a strong jet stream, they can benefit from the fast-moving air to increase speed and save fuel. This is why flights from west to east are generally faster than those in the opposite direction.
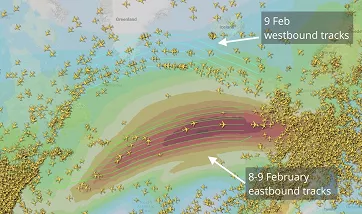
Eastbound and westbound flight tracks over the North Atlantic (8–9 February 2020); Flightradar24.com
Within North America, flight time when traveling east across the continent can be reduced by about 30 minutes if an aircraft is able to ride the jet stream.
According to Flightradar24, a powerful jet stream helped British Airways flight BA112 cross the Atlantic from New York to London in a record time of just 4 hours and 56 minutes on February 9, 2020.
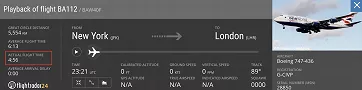
Record-breaking flight BA112 (9 February 2020); Flightradar24.com
Jet stream regions often experience rapid changes in wind speed and direction, both horizontally and vertically, a phenomenon known as wind shear. Wind shear can cause turbulence. When turbulence occurs in clear air, it is difficult to detect and predict. Such turbulence can disrupt flight smoothness, cause sudden altitude drops, and pose safety risks to passengers.

Jet stream pattern on 25 October 2021, highlighting key factors for upper-level turbulence; Aviation Weather Center
Track the Jet Stream
When forecasting the weather, it’s worth monitoring the position of the jet stream, as it can signal not only beautiful sunrises and sunsets caused by the transport of fine particles, but also the potential for dangerous intensification of stormy weather.
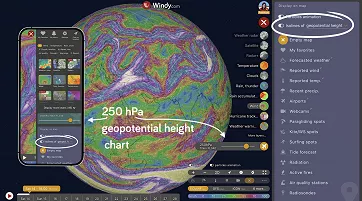
Jet streams are best identified on upper-air maps at the 250 hPa level. On Windy.com, simply select the wind forecasting layer and set the altitude to the 250 hPa pressure level. If you also enable the display of geopotential height isolines, you'll see the approximate altitude (in geopotential meters) at which the selected pressure level is located above sea level.
Comments (3)