
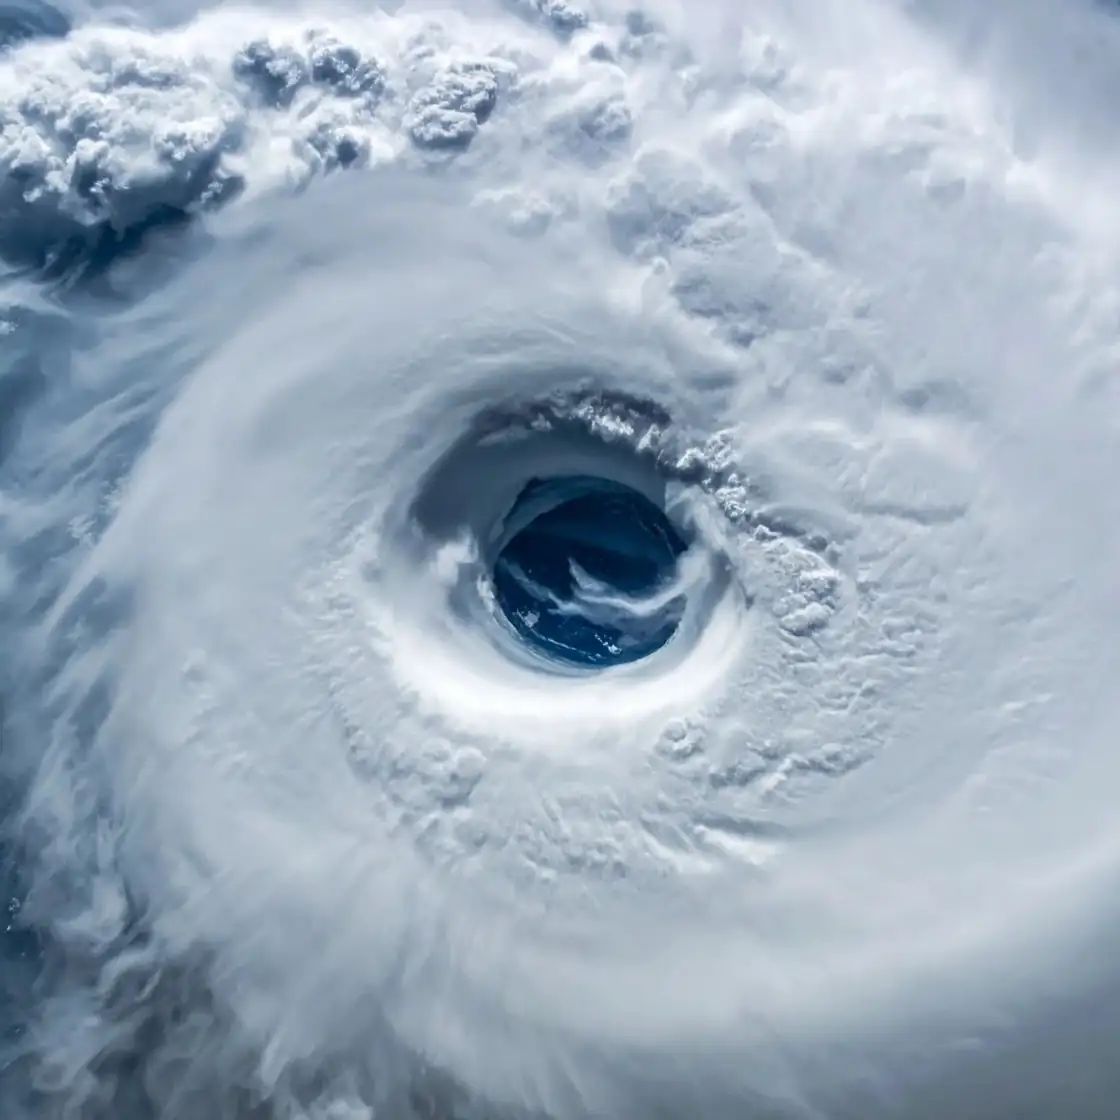
Every day, we are in contact with Earth's forces. A rising tide. A darkening sky. The smell of smoke carried on the wind. Most of the time, we barely notice. But the planet doesn't slow down when we're not paying attention.
Earth Day is a reminder of something easy to forget between news cycles: the Earth is not a backdrop. It is an active, dynamic system — one that sustains us, shapes us, and occasionally overwhelms us. At Windy, we believe that understanding the planet is the most fundamental act of respect for it — not just on April 22nd, but every day.
Here are five of Earth's most powerful forces — and how Windy helps you see them clearly, so you can act before they arrive.
1. Hurricanes, typhoons and tropical storms: tracking Earth’s most powerful systems
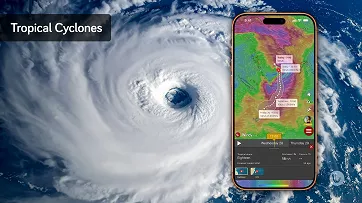
Each year, millions of people live in the potential paths of tropical cyclones — called hurricanes in the Atlantic, typhoons in the Pacific, cyclones in the Indian Ocean. These are among the most powerful organized systems on Earth, capable of reshaping coastlines in a matter of hours. And yet they are also, critically, predictable — days of warning are possible if the right information reaches the people who need it.
The challenge isn't data. It's clarity. Different meteorological institutions produce different forecasts, and diverging models create real uncertainty for anyone trying to make decisions about when to leave, where to go, and how much time they have.
Windy's Hurricane Tracker brings together trusted forecasts from global and regional meteorological institutions in a single, clear view — so you can follow storm paths, intensity shifts, and forecast uncertainty alongside the weather layers you already rely on. Not one model's interpretation, but a picture of what the consensus shows and where it diverges.
📚Learn more about hurricanes:
Hurricane, tropical storm, typhoon or tropical depression? – What these systems are and how they differ
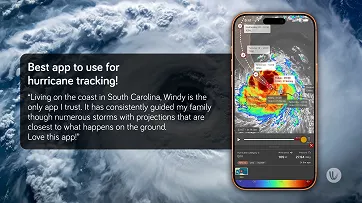
Storms, radar and live alerts: seeing danger before it arrives
Thunderstorms don't send warnings. One hour the sky is open; the next, lightning is striking within five kilometres of your location. For anyone outdoors — a hiker on a ridge, a sailor crossing open water, a family at a festival — the gap between "fine" and "dangerous" can close faster than a standard weather app refreshes.
The difference between a close call and a safe decision is often just a matter of minutes and the right information. Windy provides access to a global network of weather radars, combined with satellite imagery and live lightning detection. By watching storms in real time — and merging radar and satellite into a single layer — you can see both precipitation intensity and cloud structure at once, and understand where a storm is heading, not just where it is.
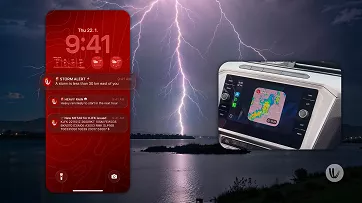
Live Alerts notify you when significant weather is approaching your location — whether that's an intense cell detected by lightning data, heavy rainfall shown in radar reflectivity, or a fast-moving front. Widgets for phones, watches, cars, and desktops keep critical information within reach. Flow vectors on radar let you read storm movement at a glance, even without meteorological training.
📚 Learn more about the storms:
Thunderstorms: how they form and what makes them powerful
Weather radar: the science behind the colorful images
2. Heatwaves: when the atmosphere traps the heat
They produce no dramatic clouds, no howling wind, no visible sign that something dangerous is happening. Yet heatwaves are statistically the deadliest category of weather event in the world — responsible for more deaths each year than hurricanes, floods, and tornadoes combined. Their threat is cumulative and quiet, which is precisely what makes them so dangerous.
In urban areas, the risk compounds. Buildings, asphalt, and limited airflow trap warmth that would otherwise dissipate overnight. Cities can be 5–10°C hotter than surrounding countryside during a sustained heat event, and night-time temperatures that fail to drop below 25°C prevent the recovery the human body depends on.
Windy helps you see not just temperature, but the atmospheric conditions that create and sustain heat stress: humidity levels, pressure patterns, and the circulation systems that determine whether relief is coming or whether the heat will remain locked in place. It's the difference between knowing it will be hot, and understanding when conditions become dangerous.
📚Learn more about heatwaves:
Heatwaves in urban areas: impacts and future challenges
3. Air quality: the invisible layer that affects us all
In the summer of 2023, smoke from Canadian wildfires turned skies orange across New York City — 2,000 kilometres from the nearest fire. This kind of event is no longer exceptional. Wildfire smoke, industrial pollution, and Saharan dust can travel continental distances, affecting air quality in places that have no obvious connection to their source.
What makes this particularly difficult is that it's invisible. You can't see PM2.5 particles. You can't feel them until they're already inside your lungs. But you can track them.
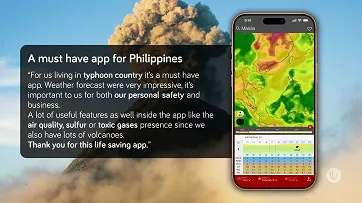
Windy's Air Quality Index (AQI) layer shows how pollutants, fine particles, and pollen move through the atmosphere in near real-time — displayed on the same map as wind direction, pressure, and cloud cover. So you can see not just where pollution is concentrated now, but where the wind is carrying it and whether your location is in the path. For parents, athletes, people with respiratory conditions, or anyone planning time outdoors, that visibility matters.
📚Learn more about Air Quality Index:
Spring in the Air: How CAMS Pollen Forecasts Are Made
4. Ocean forces and Marine Weather
The wave that breaks on a beach in Cornwall today may have been generated by a storm off the coast of Newfoundland five days ago. The ocean doesn't respect borders — it is one of the planet's primary energy transmission systems, carrying the force of distant storms thousands of kilometres before it reaches shore, a coastline, or a vessel.
This makes marine weather fundamentally different from land weather. A swell doesn't form locally. Wave height and period are the product of events that happened days earlier, in a different hemisphere. And the consequences — for sailors, surfers, fishing communities, and coastal infrastructure — can arrive with little visible warning.
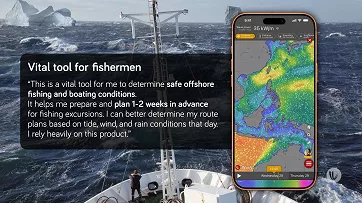
Windy's marine weather layers — Waves, Swell, Wave Period, and Wave Power — make this travelling energy visible. Sailors planning offshore passages can see swell direction and period days in advance. Surfers can read which coastline will receive a ground swell and when. Coastal communities can understand when conditions are elevated — before the sea makes itself heard.
5. Fire: Understanding Earth’s extremes causing Wildfires
Wildfires follow the wind. In drought conditions, with temperatures above 35°C and relative humidity below 20%, a single spark can become a fire line that moves faster than a person can run. Under the right conditions, embers can travel kilometres ahead of the main front — starting new fires in places that haven't yet been touched.
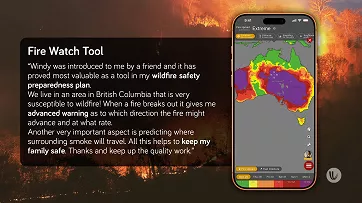
The compounding factors — sustained heat, dried vegetation, strong and shifting winds — are precisely what Windy makes visible in combination. The Fire Danger layer shows where conditions are elevated, before a fire ignites. Active Fires shows where fires are burning in real time, alongside the wind patterns carrying embers and smoke. Smoke transport seen in Aerosol layer show where air quality will be affected, often hundreds of kilometres from the source.
In a world where fire seasons are growing longer and the window between warning and arrival is narrowing, that lead time is not just useful — it's the difference that matters.
📚Learn more about Wildfires:
Canadian Smoke over Europe: a Jet Stream Story
Earth Day, every day
Earth Day is a good moment to stop and notice. The air quality index in your city this morning. The storm system forming three days out. The swell that will reach shore by Sunday. The heat that's been building since Tuesday without a forecast break.
Noticing — really seeing what the planet is doing — is where respect begins. And awareness is where preparation follows.
At Windy, making that visibility possible is what we do every day, for every person who needs to understand what's happening around them — and what may happen next.
Because the more clearly you understand the Earth, the better you can live with it.
Comments (6)