
Guadalajara
Acapulco
Mexico City
Tuxtla Gutiérrez
Guatemala
Guatemala City
Bahamas
Nassau
Monterrey
Ciudad Victoria
Baton Rouge
Louisiana
Austin
Texas
Miami
Florida
Tallahassee
Gulf of Mexico
Havana
Hamilton
Richmond
Washington
Harrisburg
New York
North Carolina
Raleigh
Virginia
Ohio
Kentucky
Tennessee
Indiana
Alabama
Georgia
Montgomery
Mississippi
Illinois
Nashville
Indianapolis
Springfield
Frankfort
Charleston
Columbia
Columbus
Atlanta
Mexico
Culiacán
Chihuahua City
Ciudad Juárez
La Paz
Hermosillo
Jackson
Arkansas
Oklahoma
Missouri
Kansas
Dallas
Jefferson City
Little Rock
Oklahoma City
Topeka
United States
Lincoln
Lamar
Amarillo
New Mexico
Santa Fe
Lubbock
Gallup
Utah
Phoenix
Arizona
Colorado
Denver
Salt Lake City
New Brunswick
Halifax
Nova Scotia
Fredericton
Charlottetown
Gulf of Saint Lawrence
Newfoundland
Maine
Quebec
Saguenay
Montpelier
Albany
Ottawa
Lake Ontario
Augusta
Boston
New York
Pennsylvania
Iowa
Fargo
Hibbing
Bismarck
North Dakota
Minnesota
Saint Paul
Des Moines
Nebraska
Pierre
South Dakota
Sudbury
Toronto
Lake Erie
Michigan
Lansing
Wisconsin
Rouyn-Noranda
Lake Michigan
Lake Huron
Wawa
Marquette
Lake Superior
Thunder Bay
Madison
Cheyenne
Wyoming
Havre
Williston
Billings
Montana
Afton
Rapid City
Helena
Bridgetown
Roseau
St. John's
Road Town
Lesser Antilles
Mérida
Managua
Honduras
Belmopan
Bilwi
Nicaragua
George Town
Cancún
Cuba
Holguín
Kingston
Port-au-Prince
Caribbean Sea
Dominican Republic
© OpenStreetMap contributors
Tuesday 22
  • 03
  • 06
  • 09
  • 12
  • 03
  • 06
  • 09
Wednesday 23
  • 03
  • 06
  • 09
  • 12
  • 03
  • 06
  • 09
Thursday 24
  • 03
  • 06
  • 09
  • 12
  • 03
  • 06
  • 09
Friday 25
  • 03
  • 06
  • 09
  • 12
  • 03
  • 06
  • 09
Saturday 26
  • 03
  • 06
  • 09
  • 12
  • 03
  • 06
  • 09
Sunday 27
  • 03
  • 06
  • 09
  • 12
  • 03
  • 06
  • 09
Monday 28
  • 03
  • 06
  • 09
  • 12
  • 03
  • 06
  • 09
Tuesday 29
  • 03
  • 06
  • 09
  • 12
  • 03
  • 06
  • 09
Wednesday 30
  • 03
  • 06
  • 09
  • 12
  • 03
  • 06
  • 09
Thursday 1
  • 03
  • 06
  • 09
  • 12
  • 03
  • 06
  • 09
Friday 2
  • 03
  • 06
  • 09
  • 12
  • 03
  • 06
  • 09
Saturday 3
  • 03
  • 06
  • 09
  • 12
  • 03
  • 06
  • 09
Sunday 4
  • 03
  • 06
  • 09
  • 12
  • 03
  • 06
  • 09
Monday 5
  • 03
  • 06
  • 09
  • 12
  • 03
  • 06
  • 09
Tuesday 6
  • 03
  • 06
  • 09
  • 12
  • 03
  • 06
  • 09
Wednesday 7
  • 03
  • 06
  • 09
  • 12
  • 03
  • 06
  • 09
9 PM
Go Premium
kt051020304060
Developed with
Download App
Feels-Like Temperature: Why the Measured Temperature May Not Match How We Feel
Jari Sochorová
-
updated 21 days ago
465
46 Comments
...

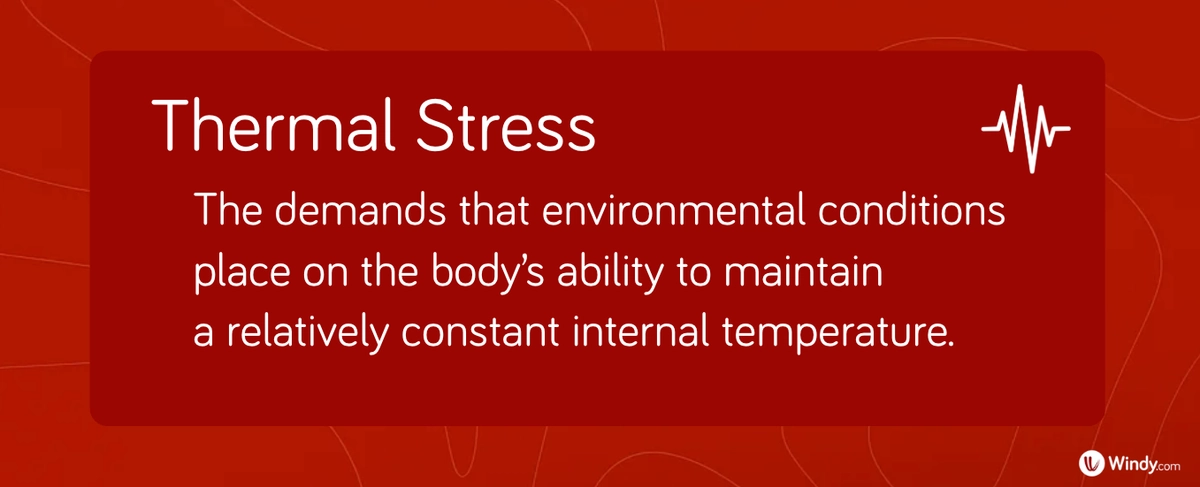
Have you ever wondered how a person can withstand several minutes in a sauna at 100°C (212°F), yet be scalded very quickly by water at just 50°C (122°F)? The main difference is that water transfers heat to the body much faster than dry air does. Temperature alone therefore does not determine how we feel in a given environment or how much thermal stress it places on the body.

When we want to know what the weather will be like, we are often most interested in the air temperature. However, air temperature does not fully reflect how warm or cold it feels to the body. Our perception is also influenced by a range of other factors, particularly humidity, wind, solar radiation, and the body’s ability to regulate its temperature.
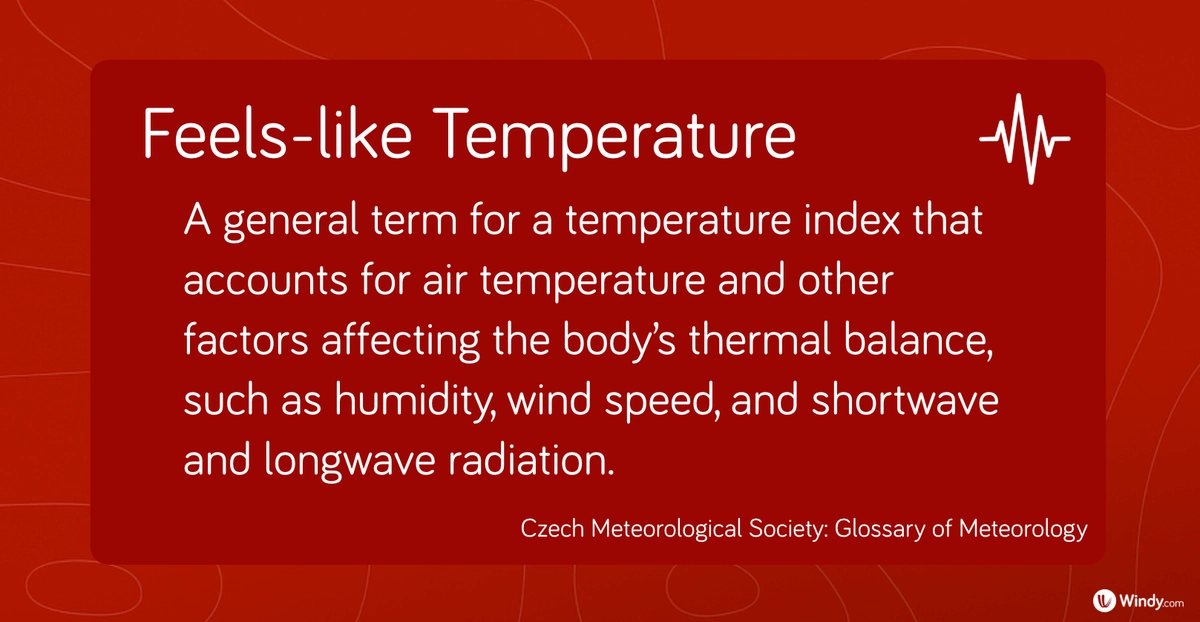
Although the perception of heat and cold is subjective to some extent, the thermal effect of the surrounding environment on the human body is described by what is known as the feels-like temperature. This is not a directly measurable physical quantity, but a derived biometeorological index calculated from environmental conditions.

This concept is studied within biometeorology, a branch of applied meteorology that examines how weather and individual meteorological variables affect living organisms.

Air temperature

Air temperature is a physical quantity that describes the thermal state of the atmosphere. In other words, it indicates how warm or cold the air is.

Air temperature is related to the random thermal motion of its molecules. In simple terms, the greater their average kinetic energy, the higher the air temperature, and vice versa. As temperature decreases, the thermal motion of particles also slows, reaching its lowest possible level at absolute zero.

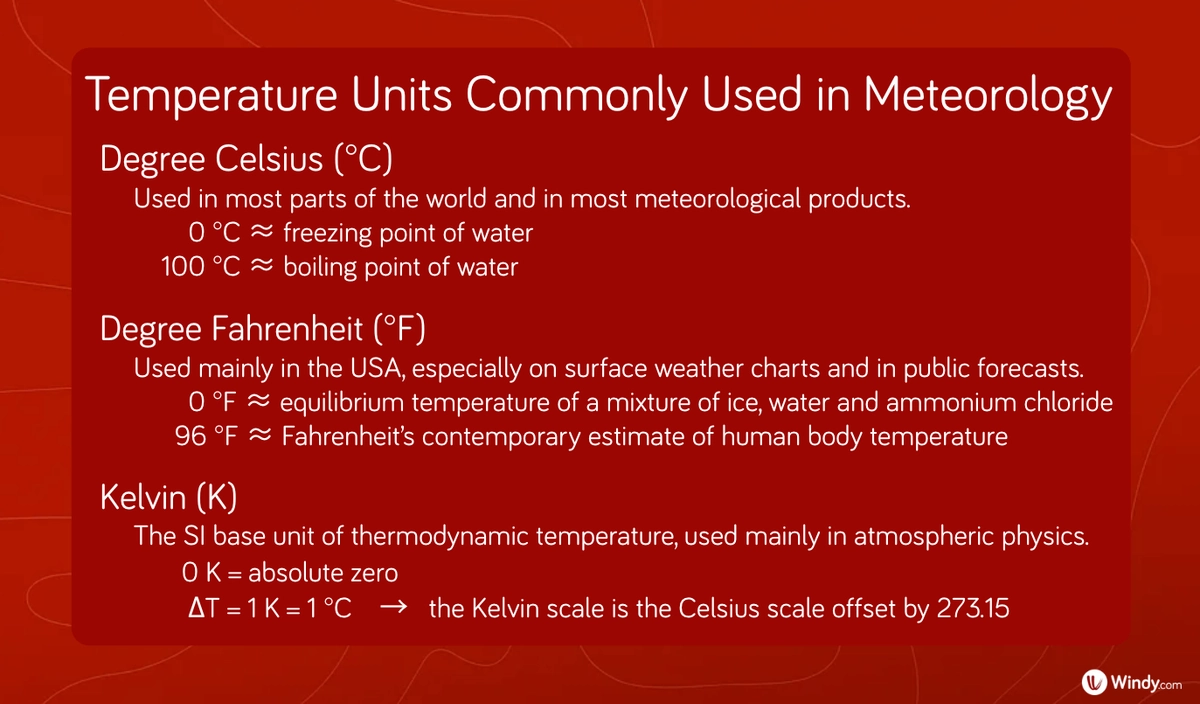
Absolute zero corresponds to 0 K, or −273.15°C (−459.67°F), and represents the lowest physically possible temperature.
In meteorology, air temperature is defined as a basic meteorological variable measured by a thermometer exposed to the air in a location protected from direct solar radiation. 

Following WMO standards helps ensure that the measured value is not influenced by factors such as direct solar radiation and that the results of individual measurements can be compared with one another.
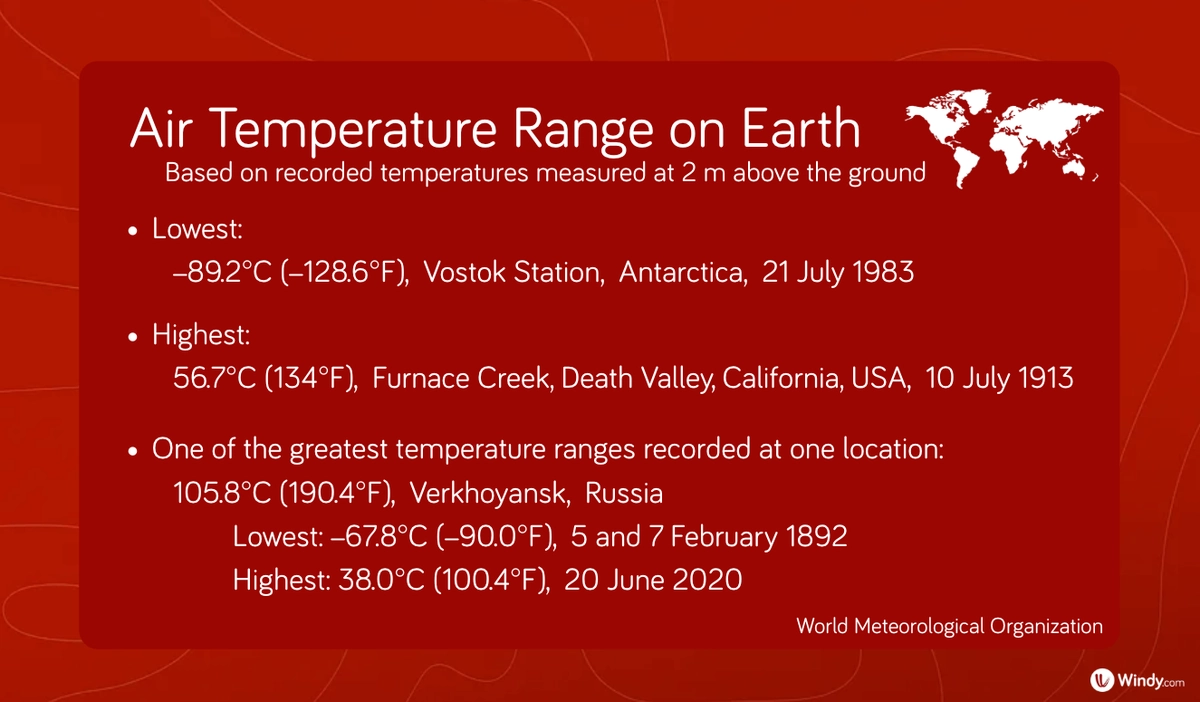
For measuring near-surface air temperature, WMO guidance includes the following principles:

  • Measurement height: the thermometer or temperature sensor should be positioned approximately 1.25 to 2.0 m above the ground.
  • Protection from radiation and precipitation: the thermometer or temperature sensor should be housed in a radiation shield or instrument shelter that protects it from direct solar radiation, radiation from surrounding surfaces, and precipitation.
  • Adequate ventilation: the shield or shelter must allow sufficient airflow so that the thermometer or temperature sensor measures the temperature of the surrounding air rather than air warmed inside the enclosure.
  • Suitable siting: the site should be representative of its surroundings and, where possible, located over natural, level ground, usually covered with short grass. The thermometer or temperature sensor should be positioned away from buildings, trees, paved surfaces, air-conditioning units, and other sources of artificial heating.
  • Instrument maintenance: the thermometer or temperature sensor should be inspected and maintained regularly, with its calibration checked at appropriate intervals.

In standard weather forecasts, air temperature is generally given at a height of 2 m above the ground unless stated otherwise. This height approximately corresponds to the standard measurement height at weather stations, allowing forecast temperatures to be compared with observations and forecast performance to be verified.

Human body temperature and heat exchange with the environment

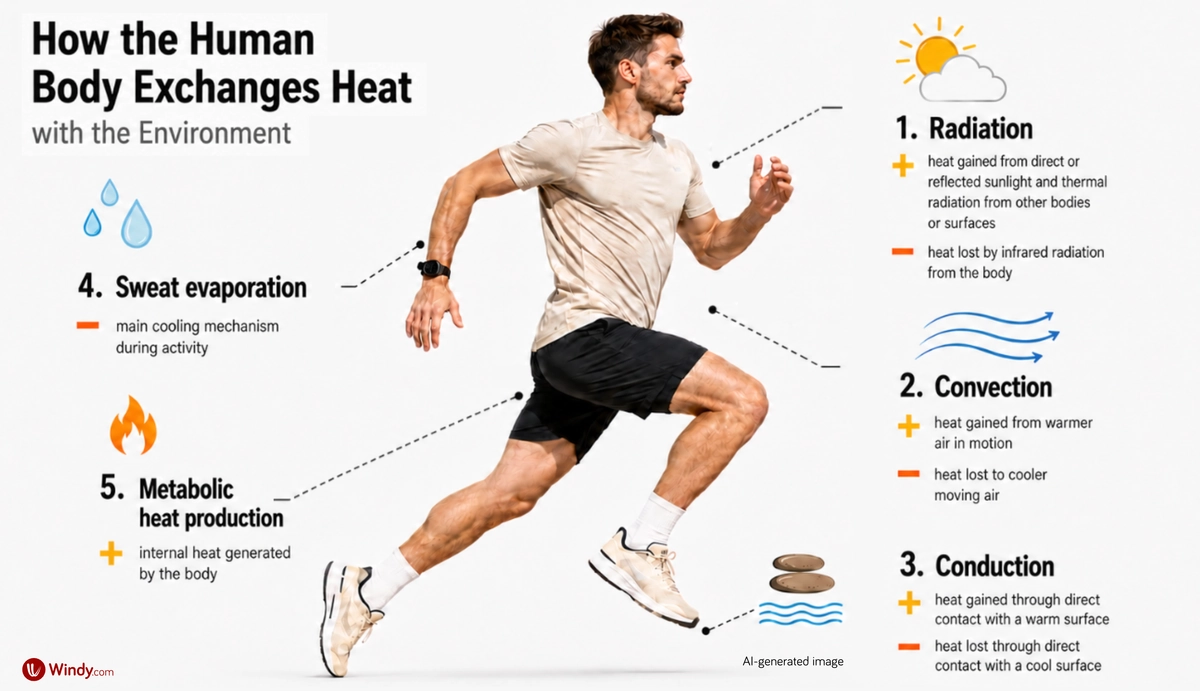
The human body maintains a relatively stable internal temperature, usually around 37°C (98,6°F). It generates heat itself, primarily through metabolism, but it can also gain or lose heat through energy exchange with the surrounding environment.

To avoid overheating or becoming too cold, the body must continuously balance the heat it produces and gains with the heat it loses to the environment.

The human body exchanges heat with its surroundings through conduction, convection, and radiation.

Conduction occurs through direct contact between the skin and the surrounding environment, such as air, water, or a solid surface.

Convection takes place in fluids, namely air and water, whose movement transfers energy between the skin and the surroundings.

The human body, like all objects with a temperature above absolute zero, emits electromagnetic radiation. The higher an object’s temperature, the more energy it radiates (Stefan–Boltzmann law). Through radiation, the body exchanges energy with its surroundings without being in direct contact with them.

The net transfer of heat is from a warmer body or environment to a cooler one (second law of thermodynamics).

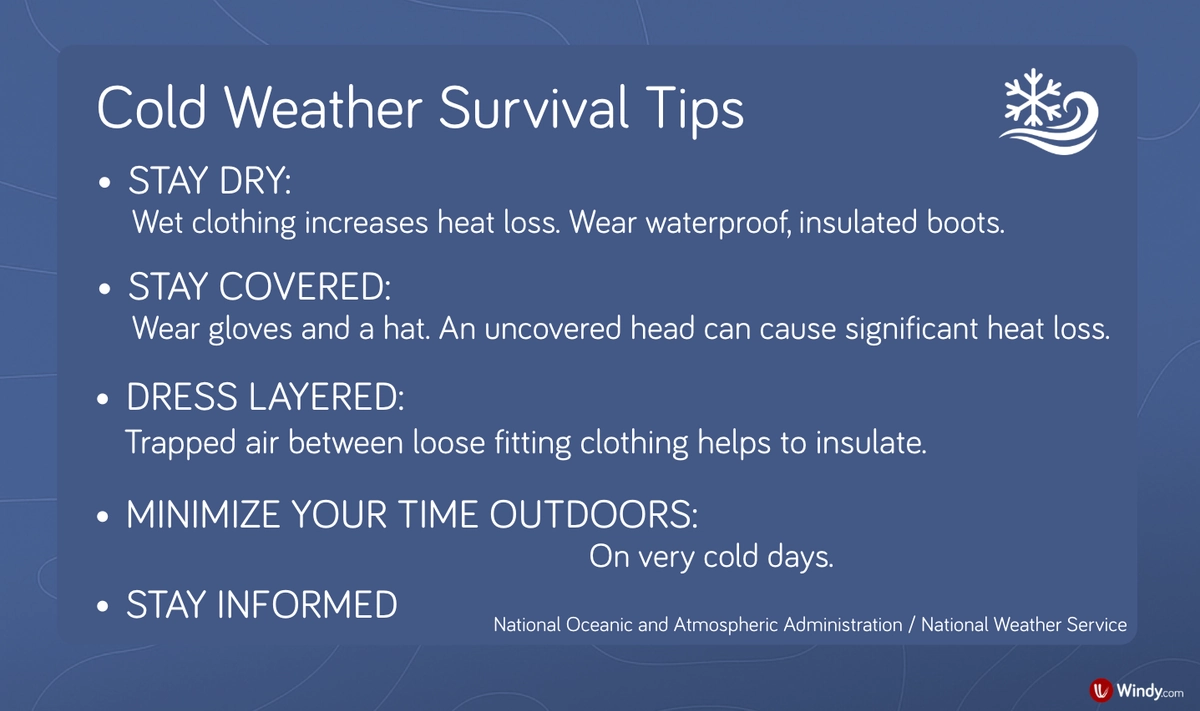
When the surrounding air is cooler than the skin, the body transfers heat to it and cools down. A thin layer of air in direct contact with the skin is warmed by conduction. Convection carries this warmed layer away and replaces it with cooler air, maintaining the temperature difference and increasing heat loss from the body. In cooler conditions, the body also usually loses energy through radiation.

The body counteracts cooling by constricting blood vessels in the skin, thereby reducing the flow of warm blood to the body’s surface. In colder conditions, it can increase heat production through shivering and by increasing its metabolic rate.

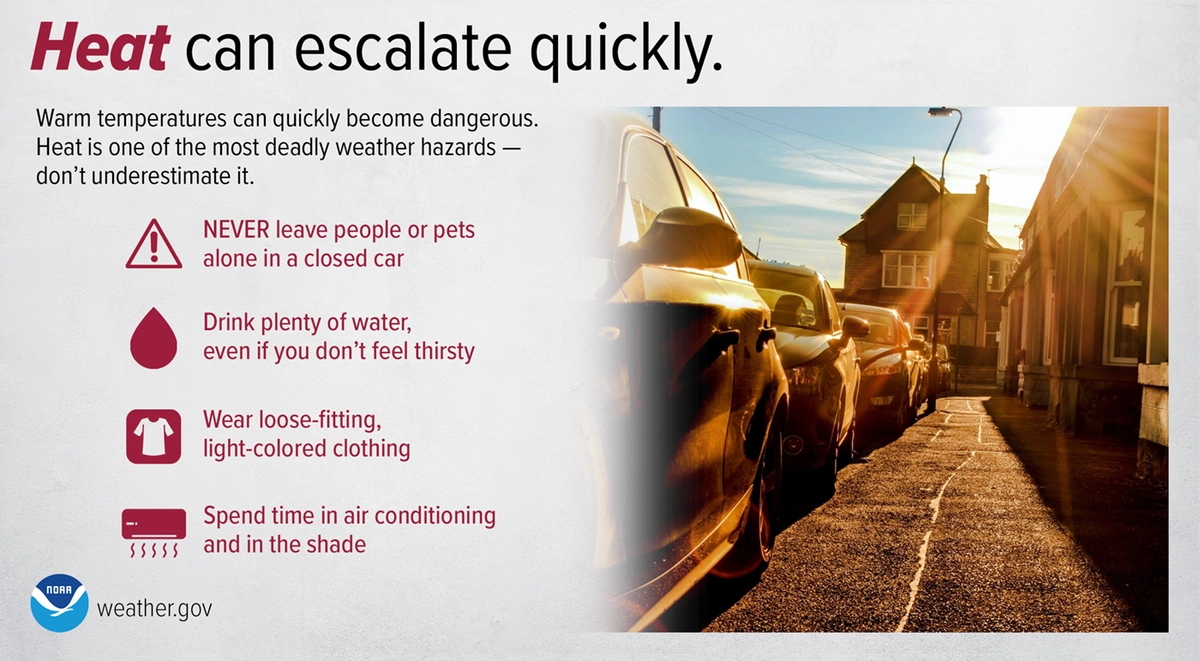
Conversely, when the surrounding air is warmer than the skin, the direction of heat transfer by conduction and convection is reversed, and the body gains energy from the surrounding air and warms up. Convection brings additional warm air to the skin and can therefore intensify this warming. At the same time, the body may also gain energy from direct solar radiation or from hot surrounding surfaces.

The body counteracts overheating by dilating blood vessels in the skin and increasing sweating. The dilated blood vessels carry more warm blood from the body’s core to its surface. However, when the surroundings are warmer than the skin, the body can no longer release this heat effectively through conduction or convection. Evaporation of sweat therefore becomes the main way the body cools itself

Human sweat consists mainly of water, approximately 99%. During evaporation, water changes into water vapour. This change of state requires energy, known as the latent heat of vaporisation. This energy is drawn from the immediate surroundings, including the surface of the skin, which cools as a result. The skin is therefore cooled not by sweating itself, but only when the sweat evaporates.

Finding ways to express feels-like temperature

Over the past century, extensive research has examined how different meteorological variables influence the way people perceive temperature.

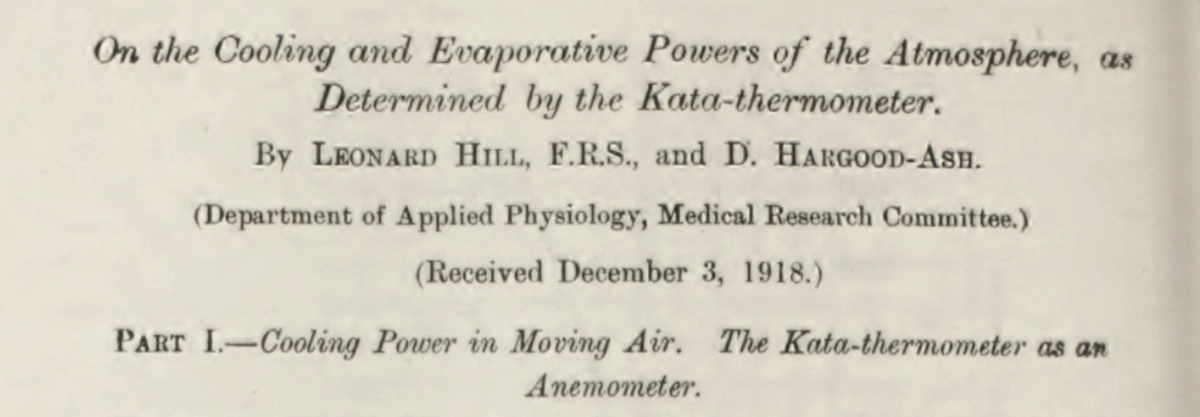
As early as 1916, Leonard Hill introduced the kata thermometer to measure the cooling power of the surrounding air, that is, the rate of heat loss from a warm surface. Wind-tunnel experiments later made it possible to determine how this cooling depended on factors such as wind speed, humidity, and air temperature. Siple and Passel later applied the same principle when developing the wind chill index (see the Wind Chill section).

Part of the first page of a 1919 article by Leonard Hill and Hargood-Ash; Royal Society Publishing

More than 100 different indices are estimated to have been developed over the course of the twentieth century, some of which are still used today.

Among the most commonly used measures of feels-like temperature and thermal stress are the Heat Index, Wind Chill Temperature Index, Wet Bulb Globe Temperature, and Universal Thermal Climate Index.

Heat Index

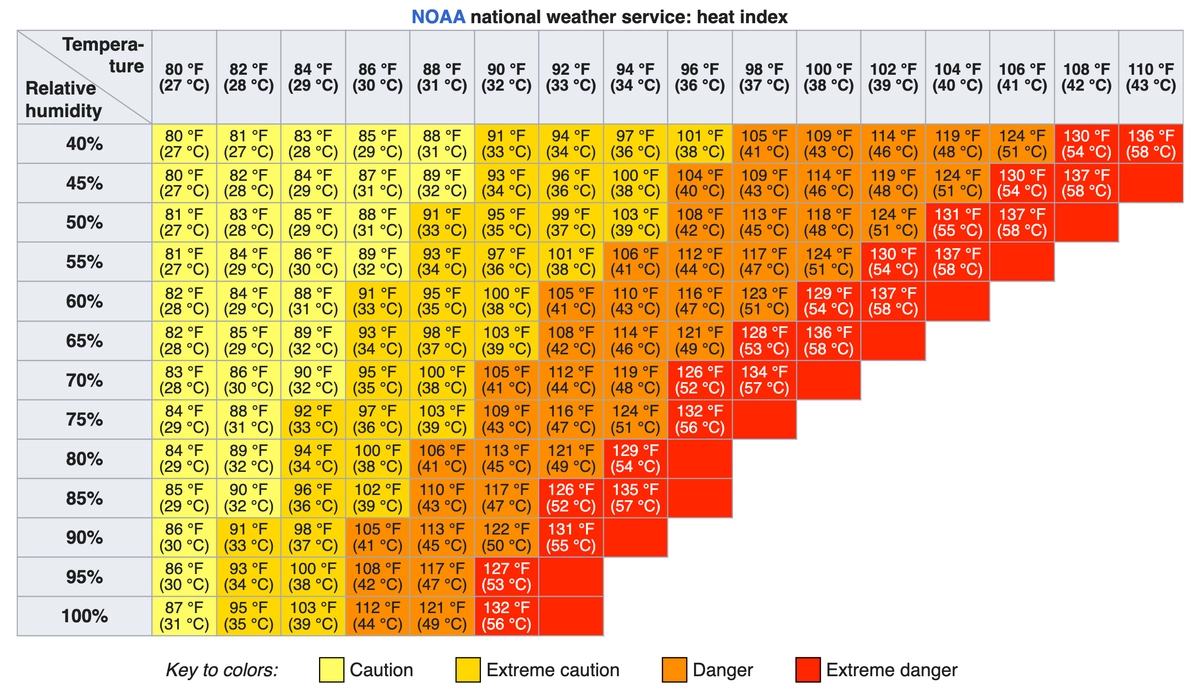
The Heat Index (HI) indicates approximately how hot conditions feel to the human body based on the combination of air temperature and relative humidity. The Heat Index is based on work by R. G. Steadman published in 1979. 

In general, high temperatures are more tolerable in dry air, while high relative humidity intensifies the sensation of heat.

At lower humidity, the Heat Index generally does not differ greatly from the actual air temperature. It rises more substantially when high air temperatures coincide with high relative humidity. For example, at 35°C (95°F) and a relative humidity of 75%, the feels-like temperature may be as much as 20°C higher, significantly increasing heat stress on the body.

Heat Index: How perceived temperature changes with air temperature and relative humidity; NOAA via Wikipedia

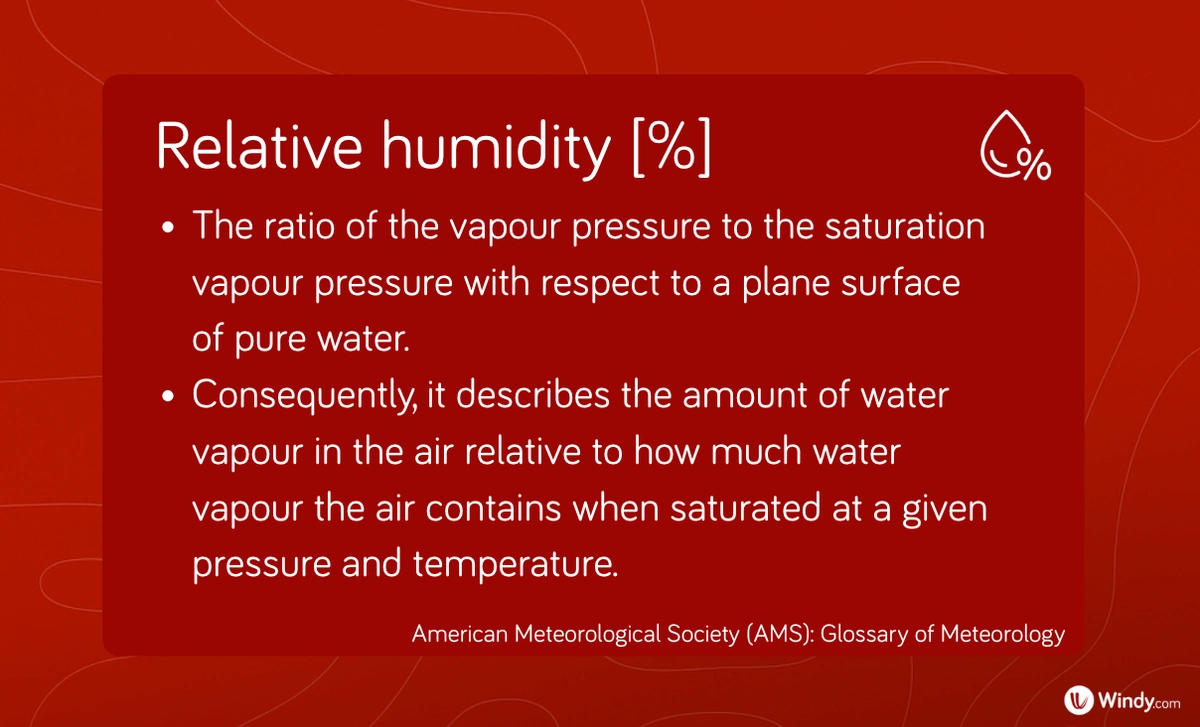
This is because, at high relative humidity, sweat evaporates less efficiently from the skin. Sweat evaporates most readily in drier air, which can take up more water vapour. At high relative humidity, however, the air already contains a large amount of water vapour. The difference in humidity between the air immediately above the skin and the surrounding air is therefore smaller, slowing the evaporation of sweat. A person may sweat heavily, but some of the sweat remains on the skin. If the sweat does not evaporate, it does not remove energy from the skin, so the body is not cooled in this way.

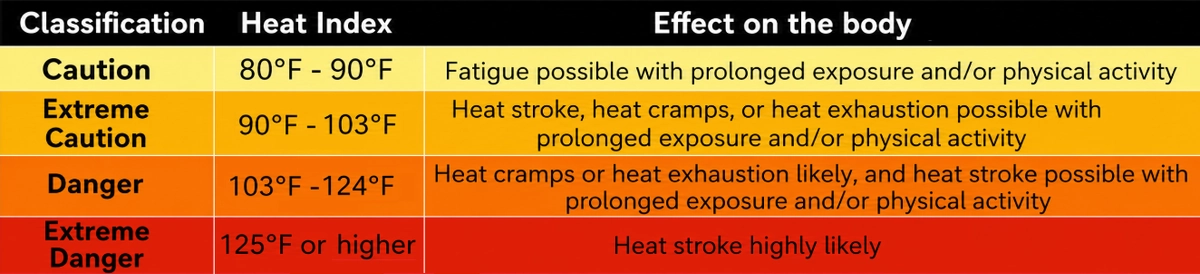
Heat Index categories and effects on the body; NOAA

Heat Index values are calculated for shaded conditions with light winds.

Wind Chill 

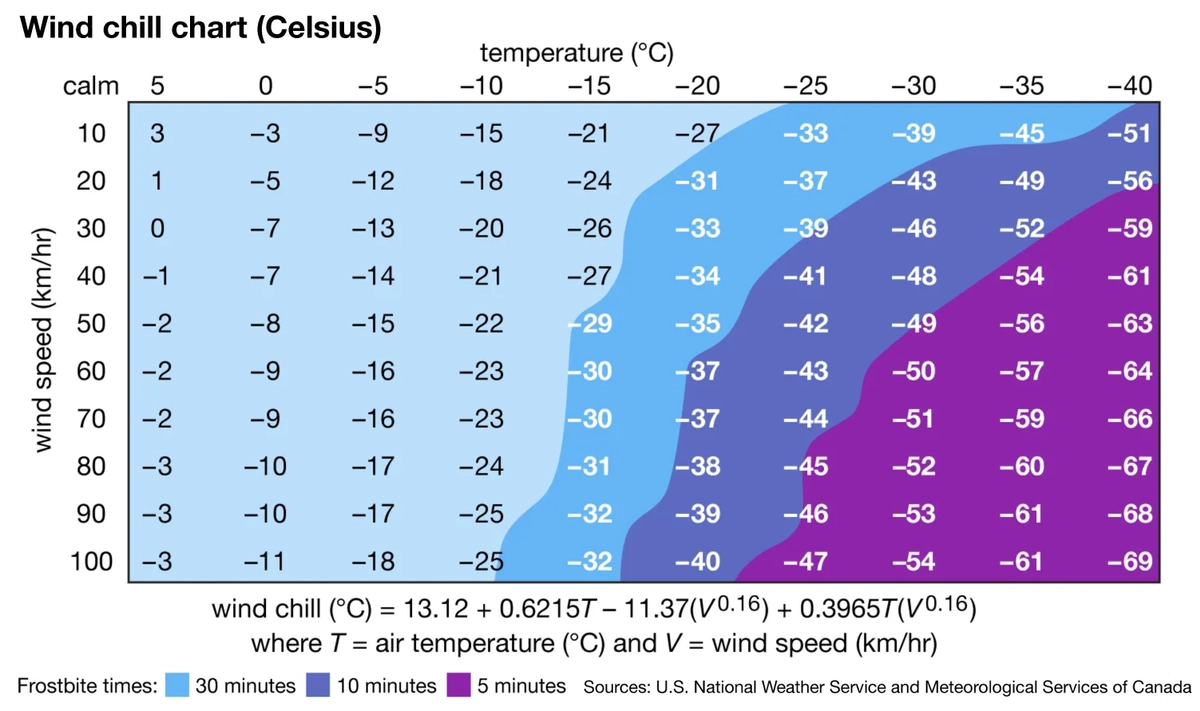
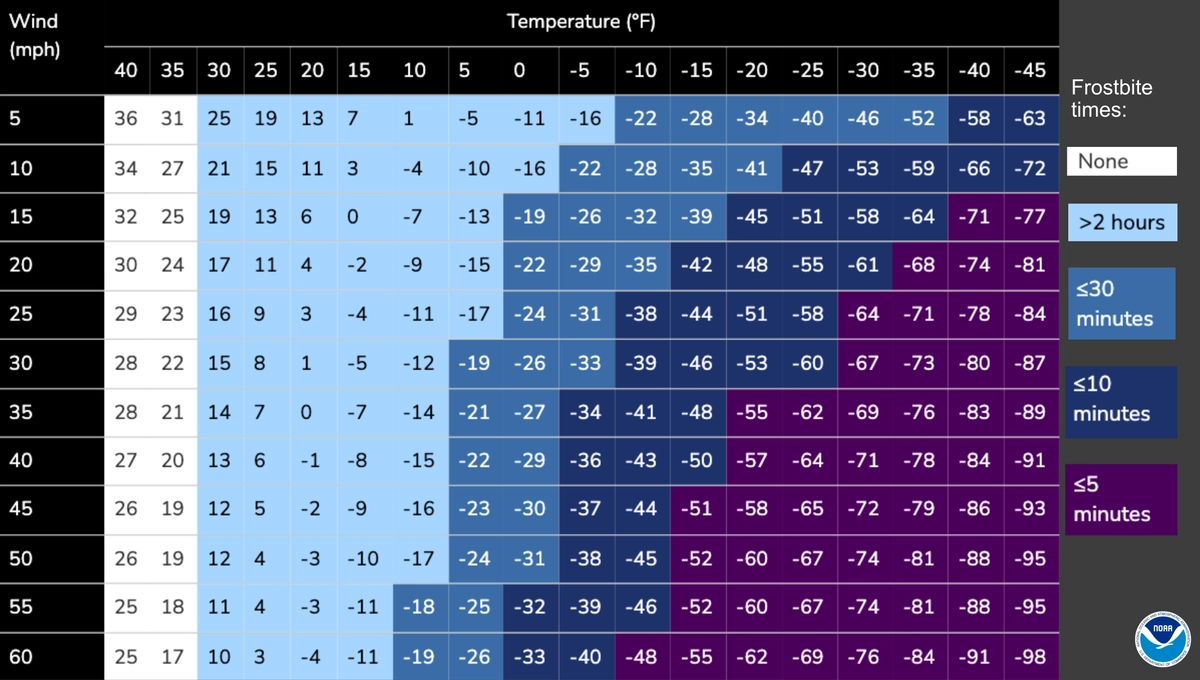
Wind chill describes how quickly exposed human skin loses heat under the combined effects of cold air and wind. The cooling effect of wind is most pronounced at air temperatures below approximately 7°C (45°F).

Different formulas are used to express wind chill, including the older wind chill equivalent temperature and the Wind Chill Temperature Index, which is more commonly used today. The historical precursor to these calculations was the Siple–Passel index developed in 1945.

When the air is colder than the skin, the body warms a thin layer of air immediately next to it. In calm conditions, this layer remains close to the skin and partly limits further heat loss. Wind disrupts and carries away this layer, replacing it with colder air, so the body loses heat more rapidly and cools down.

Wind Chill Temperature Index in °C and km/h; Encyclopædia Britannica, Inc.

Wind alone cannot lower the temperature of dry skin below the actual temperature of the surrounding air. If the skin is wet, however, evaporation can cool it below the surrounding air temperature.

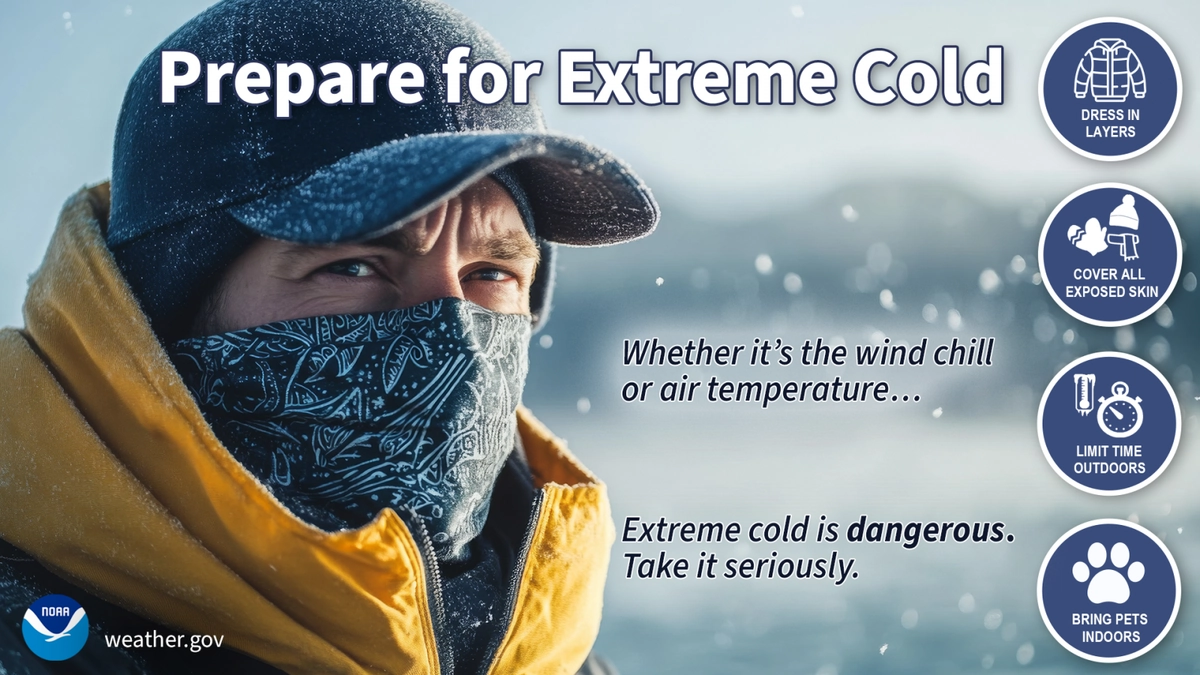
As wind chill decreases, the risk of hypothermia rises and, when air temperatures are below freezing, so does the risk of frostbite. Hypothermia occurs when the body’s core temperature falls below 35°C. Frostbite results from the freezing of body tissue and poses the greatest risk to exposed parts of the body, such as the fingers, ears, and nose.

At an air temperature of −18°C (0°F) in calm conditions, it may take more than 30 minutes for exposed skin to freeze. With winds of approximately 90 km/h (55 mph), however, the wind chill is about −36°C (−32°F), and frostbite may develop within about 10 minutes.

Wind Chill Temperature Index in °F and mph; NOAA Jet Stream

Wet-Bulb Temperature

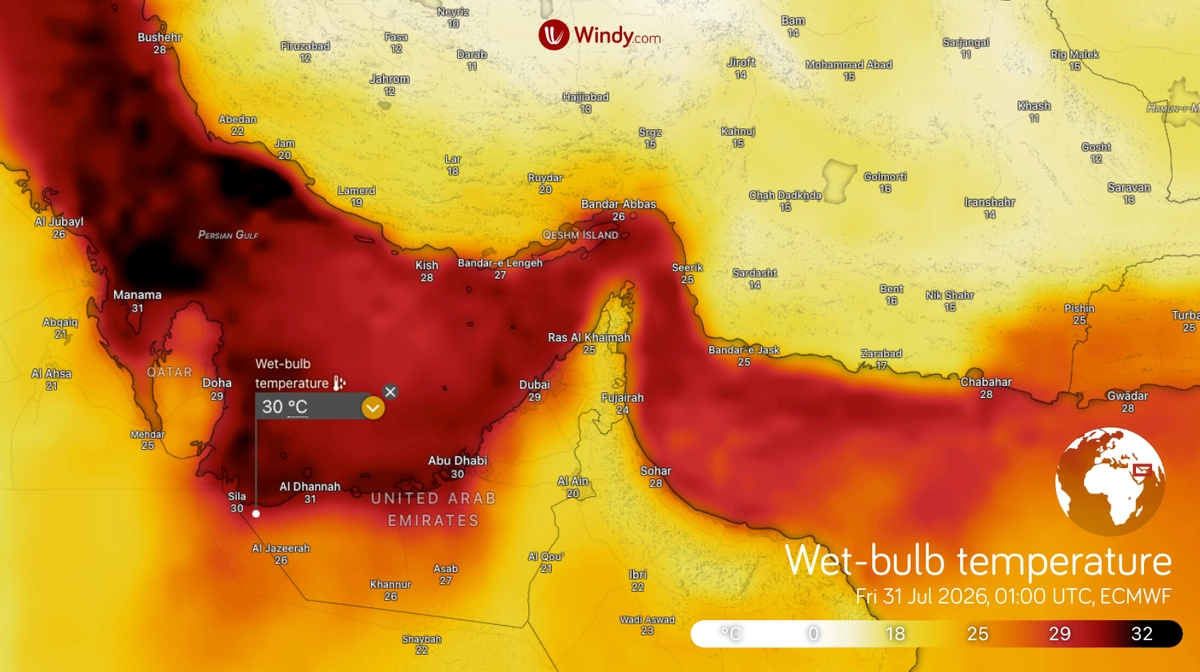
Wet-Bulb Temperature (WBT) can also be used as an indicator of heat stress. WBT is a measurable physical quantity that can also be calculated from air temperature, relative humidity, and atmospheric pressure.

It indicates the lowest temperature to which a wet surface can be cooled through the evaporation of water. It is measured using a thermometer whose sensor is wrapped in a moistened cloth and exposed to sufficient airflow.

The resulting value depends primarily on air temperature and humidity. The higher the relative humidity, the closer the WBT is to the actual air temperature. A high WBT therefore indicates conditions in which the human body has difficulty cooling itself through sweat evaporation (see the Heat Index section). A value of 35°C has traditionally been regarded as the theoretical upper limit for human survival. More recent experimental research, however, suggests that the body may lose its ability to maintain thermal balance at substantially lower values.

Wet Bulb Globe Temperature

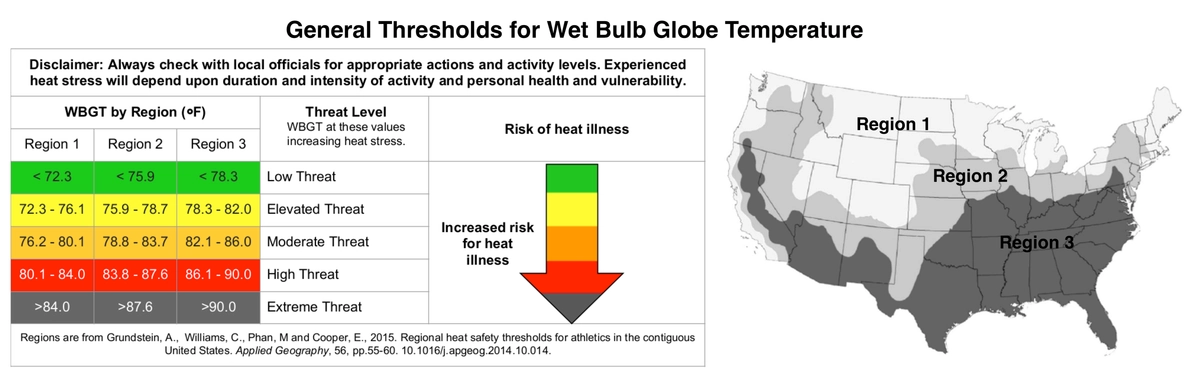
The Wet Bulb Globe Temperature (WBGT) accounts for air temperature and humidity, wind speed, and thermal radiation, including direct solar radiation. WBGT can be calculated from measurements taken with an instrument that measures natural wet-bulb temperature, black globe temperature, and air temperature. It can also be estimated from meteorological variables and local conditions.

WBGT is a practical indicator of heat stress, particularly for people who work or exercise outdoors. It is used by many organisations when planning work, sports, educational, and other outdoor activities

For example, during the Tokyo 2020 Olympic Games, which were held in 2021, WBGT was used to monitor heat stress and to guide measures designed to protect athletes.

NOAA’s Wet Bulb Globe Temperature Thresholds in the USA; NOAA

Universal Thermal Climate Index

Another widely used indicator of thermal stress is the Universal Thermal Climate Index (UTCI). UTCI describes how the human body responds to the thermal conditions of the surrounding environment, based on a combination of air temperature and humidity, wind speed, and shortwave and longwave radiation.

UTCI can be used throughout the year in both warm and cold climatic conditions, and to assess areas and time periods of different scales. Because of this broad applicability, it is used, for example, by the Copernicus Climate Change Service in its climate maps and analyses.

UTCI is commonly divided into 10 categories of thermal stress, ranging from extreme cold stress to extreme heat stress.

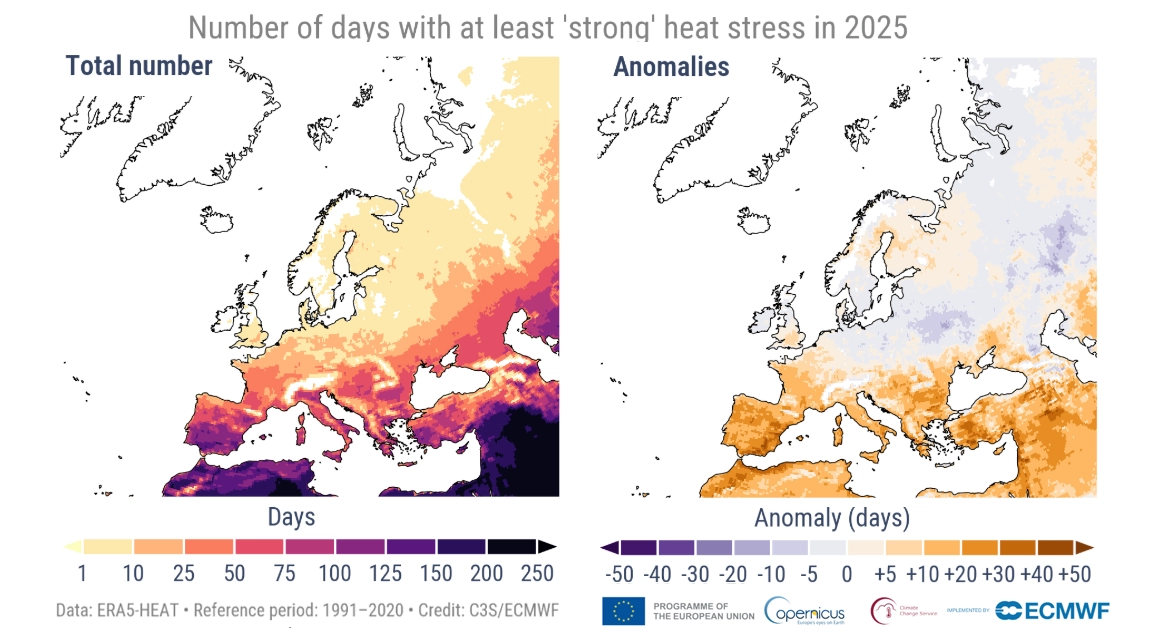
Number of days with at least ‘strong’ heat stress in 2025 (left), and associated anomalies relative to the 1991–2020 average (right). A day with at least strong heat stress has a maximum feels-like temperature, based on the Universal Thermal Climate Index (UTCI), of at least 32°C; Copernicus

Feels-Like Temperature on Windy.com

In the point forecast for a selected location, the feels-like temperature is displayed directly below the forecast air temperature at 2 m above the ground. This makes it easy to compare the two values.

To calculate the feels-like temperature, Windy.com combines the Wind Chill Temperature Index and the Heat Index. Wind chill is used at temperatures below 11°C, while the Heat Index is used at temperatures above 26°C. Between 11°C and 26°C, the effects of wind and relative humidity are not included in the calculation, so the feels-like temperature is the same as the forecast air temperature.

To assess thermal conditions, you can select the Wet Bulb Temperature layer from the map layer menu. This allows you to see at a glance where the combination of high temperature and humidity may place the greatest strain on the human body.


465 claps

Comments (46)