
 Nicole Dolezalova
 From wildfires across France and Spain this July to smoke-covered skies over Canada and the USA, fire seasons are getting harder to ignore. Windy brings three layers together so you can read the risk, spot active fires, and check the air you are breathing, all in one map.
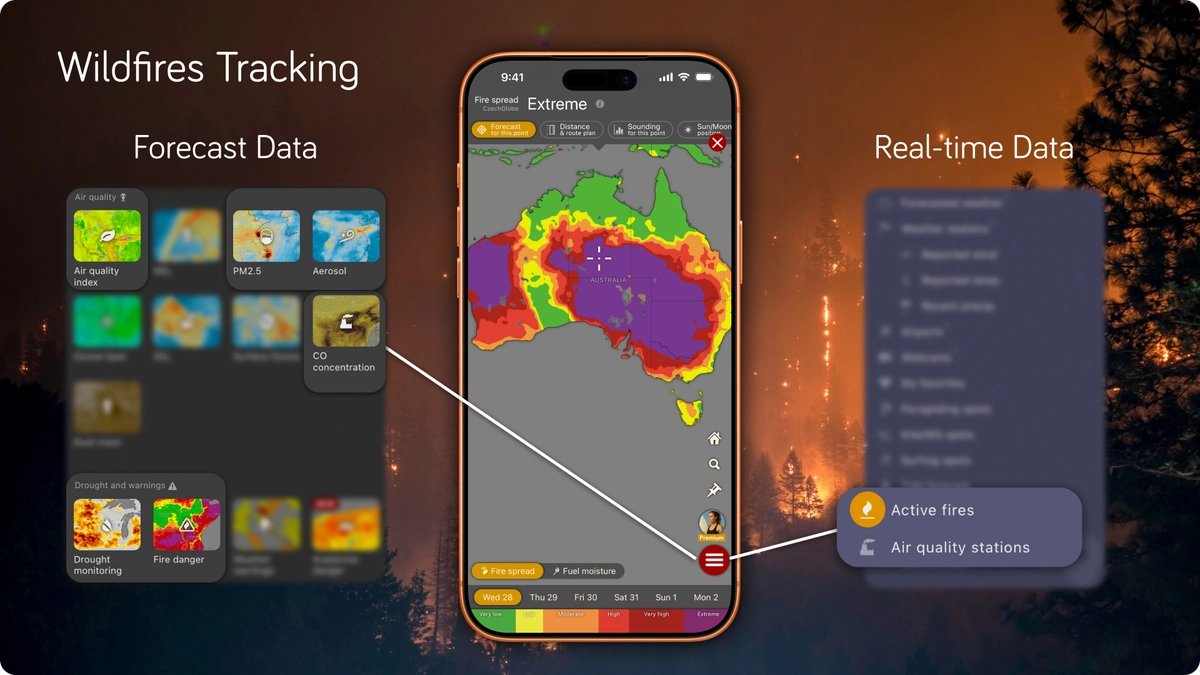
Wildfire Tracking. Everything you need to follow wildfire potential and danger in one map on Windy.com.
🔥 Fire Danger with hourly forecast
Track wildfire potential before it starts
Developed by CzechGlobe and available exclusively on Windy.com, the Fire danger layer updates with version 51 in hourly steps. Switch between Fire spread and Fuel moisture to read exactly how conditions are shifting.
Fire spread
Shows how conducive weather and fuel conditions are to a wildfire starting and spreading, based on the Canadian Forest Fire Weather Index (FWI). It rates danger across six levels, from Very low to Extreme, with thresholds tuned to 18 global environmental zones so the reading fits the local vegetation and climate. Calculated from temperature, humidity, wind, and precipitation for today and the next 14 days on the ECMWF model.
Global Fire spread forecast. The Fire danger layer with Active fires on Windy.com shows major wildfires near Madrid and Valencia (Spain), Bordeaux (France), Oregon (USA), and British Columbia (Canada). The forecast covers potential fire spread from July 29 to 31, 2026.
Fuel moisture
Shows how much water is in the biomass, the single biggest factor in how easily fuel ignites. Three sub-layers cover 10-hour, 100-hour, and 1000-hour dead fuels, from small branches to fallen trunks, so you can see when the fine fuel is tinder-dry even while the heavy stuff stays damp. Ignition risk climbs as values drop below 15%, and readings under 6% across all three classes signal possible extreme fire behaviour.
Global Fuel moisture forecast. The same view with the Fire danger layer and Active fires on Windy.com, covering the wildfires near Madrid and Valencia (Spain), Bordeaux (France), Oregon (USA), and British Columbia (Canada), from July 29 to 31, 2026.
🌫️ Air Quality
Know what the smoke is doing to the air
Wildfire smoke can travel far beyond the flames. Switch to the Air Quality layer to check the AQI around an affected area and plan whether it is safe to be outside, breathe easy, or stay in. The forecast is powered by CAMS, the Copernicus Atmosphere Monitoring Service.
The Air Quality layer with Active fires on Windy.com shows how smoke from the wildfires near Madrid and Valencia (Spain), Bordeaux (France), Oregon (USA), and British Columbia (Canada) spreads across the world. The air quality forecast covers July 29 to 31, 2026.
🛰️ Real-time data: see how the forecast matches reality
Real fires from satellites, real air from weather stations
The Fire danger and Air Quality layers are forecasts, so Windy also brings in real, observed data to see how well the model matches what is happening on the ground. Active fires come straight from NASA satellites, provided by NASA FIRMS and refreshed in Windy every hour. Each fire shows its Fire Radiative Power (FRP): the pixel-integrated radiative power in megawatts over a square kilometre. A single pixel is roughly 300 metres across, marked on the minimap by a circle at its approximate location, and to capture fires larger than one pixel we show the total area of a fire cluster. For more on how the data is collected, see the FIRMS FAQ at NASA.
Keep in mind: NASA FIRMS detects every heat source, including industrial sites, farming, and solar farms. Not every point on the map is a threat to you.
And with weather stations you can read live air quality measurements from real sensors on the ground, tap a station to compare its readings against the forecast layer.
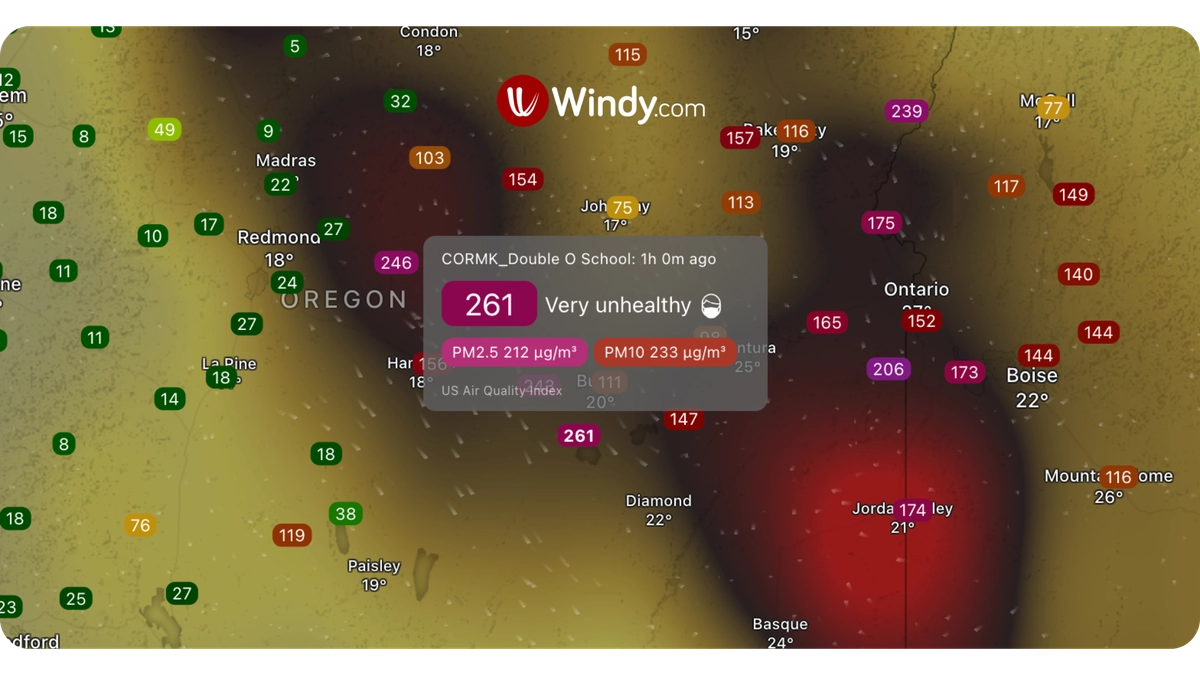
A weather station detail on Windy.com showing live PM2.5 and PM10 readings during the wildfires in Oregon (USA) on July 30, 2026.
Active fires and Air Quality weather stations on Windy.com reveal the real impact of the wildfires in Oregon (USA) on July 29, 2026. The Air Quality Index, PM2.5, and CO concentration readings all reflect the smoke on the map.
🌲 Travelling in a fire-prone region? Do your part
The map warns you, but people start most wildfires
Up to 85% of wildfires are started by people, and unattended campfires and discarded cigarettes are among the most common causes. When a high Fire danger reading lines up with a dry or drought-hit area, three basic habits make the difference:
1. No open flames
Skip campfires, barbecues, grills, and stoves when danger is High or above, never toss a cigarette, and always follow local fire bans.
2. Watch what can spark
Keep hot exhausts, machinery, and fireworks away from dry grass, and store loose batteries and power banks safely, a damaged or short-circuited battery can ignite in the heat. Take glass and litter with you, both can concentrate the sun and start a fire.
3. Have an exit and report fast
Check conditions before you go, note the nearest way out, and if you spot a fire starting, call emergency services straight away.
Tried the new Fire danger layer? Have feedback or ideas for what should come next? Let us know in the comments. Thanks for being part of the Windy community, and stay safe out there.
Comments (18)