
Meteorological spring began in the Northern Hemisphere on Sunday, 1 March. Astronomical spring follows with the vernal equinox on 20 March. Across many parts of Europe, the first low concentrations of alder pollen are already being observed, and as temperatures rise and days grow longer, pollen levels are expected to increase rapidly.
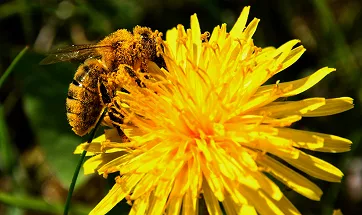
After winter, flowering plants are a welcome sign of the new season for many of us, but for allergy sufferers, they also mark the start of symptoms. Pollen grains can trigger hay fever, asthma, or conjunctivitis. It is estimated that about one in four Europeans suffers from pollen allergy, making it one of the most common chronic conditions.
The timing of flowering and the amount of pollen in the air are closely linked to the weather. Meteorological conditions determine when plants start to bloom, how much pollen they release, how far the wind carries it, and when it gradually settles back to the ground. If we can describe when and how much pollen is released, numerical atmospheric models can be used to forecast pollen concentrations.
Pollen forecasts help allergy sufferers plan everyday activities and also allow them to start or adjust treatment in time, following medical advice, thereby reducing the risk of symptoms worsening during the season.
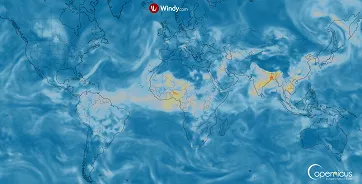
On Windy.com, you can view pollen concentration forecasts for selected pollen types at any location in Europe. These forecasts are provided by the Copernicus Atmosphere Monitoring Service (CAMS).
In this article, we will take a simplified look at how this pollen forecast is produced.
What is CAMS, and what does it provide?
The Copernicus Atmosphere Monitoring Service (CAMS) is part of the Copernicus programme and focuses on atmospheric composition monitoring. It is operated by the European Centre for Medium-Range Weather Forecasts (ECMWF). Its goal is to provide high-quality, well-documented, and openly accessible information on air pollution and other atmospheric components at global and European scales.
CAMS produces near-real-time analyses and forecasts of atmospheric composition, as well as long-term reanalyses that enable assessment of past developments and trends. Key products include forecasts of major air-quality pollutants such as particulate matter (PM₁₀ and PM₂.₅), nitrogen dioxide (NO₂), and ozone (O₃), as well as aerosol forecasts (including Saharan dust and wildfire smoke), estimates of fire emissions (GFAS), and information on the ozone layer and UV radiation. On the European scale, CAMS also provides pollen forecasts.
Why are CAMS pollen forecasts available only for Europe?
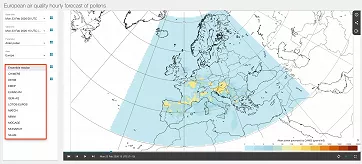
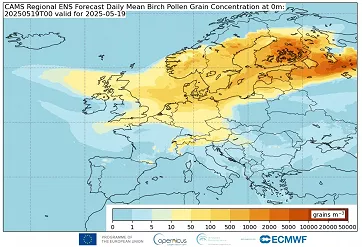
CAMS pollen forecasts are part of the CAMS Regional Production System. This system is designed specifically for the European domain, with a horizontal resolution of 0.1° × 0.1° (about 10 km). It uses detailed European vegetation datasets and a dense observation network, and is therefore not part of the global CAMS system.
The CAMS Regional Production System is based on 11 European chemical transport models for air quality: CHIMERE (INERIS, France), EMEP (MET Norway, Norway), EURAD-IM (Jülich IEK, Germany), LOTOS-EUROS (KNMI and TNO, the Netherlands), MATCH (SMHI, Sweden), MOCAGE (Météo-France, France), SILAM (FMI, Finland), DEHM (Aarhus University, Denmark), GEM-AQ (IEP-NRI, Poland), MONARCH (BSC, Spain), and MINNI (ENEA, Italy).
Coordination is provided by the Central Regional Production Unit (CRPU), led by Météo-France. Each model produces its own pollen forecast. Forecasts are run at 00 UTC and are available hourly up to four days ahead (T+96). The CRPU then combines the individual outputs into an ensemble product, typically as the median at each grid point.
On the Copernicus website, both the individual model outputs and the combined ensemble product are available.
Which pollen types are included in the forecast?
Six pollen types are included in the forecast: alder, birch, olive, grasses, mugwort, and ragweed.
These are among the most important pollen allergens in Europe, both because of their wide geographic distribution and because they can trigger allergic reactions in a substantial part of the European population.
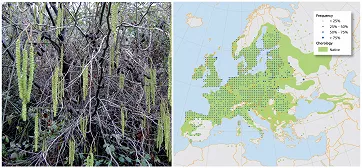
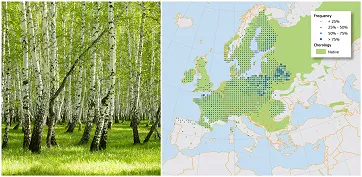
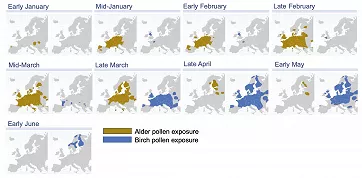
In early spring, alder and birch are among the most significant pollen sources, especially across northern and central Europe. In many regions, alder can start the pollen season in the winter months, while birch dominates spring and is among the most allergenic tree pollens. Pollen from these trees most commonly causes allergic rhinitis and conjunctivitis, and in more sensitive individuals, it can also worsen asthma symptoms. Birch pollen is also well known for cross-reactivity with certain foods, which can trigger symptoms after eating some types of fruit or nuts. In Europe, around 8–16% of the population is sensitised to birch pollen.
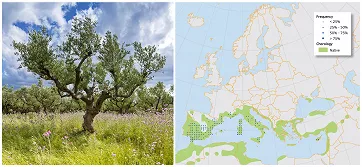
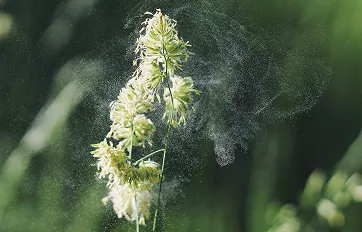
From late spring into early summer, grasses dominate and are widespread across almost all of Europe. They are the most widespread source of airborne pollen and one of the most common triggers of pollen allergy. Typical symptoms include hay fever, allergic conjunctivitis, and, often, asthma-like symptoms. Grass pollen is recognised as one of the principal causes of pollen allergy in Europe, with national sensitisation rates of up to ~26% reported in some countries, although values vary by region and study population. In the Mediterranean region, olive tree pollen is another important spring and early-summer allergen, and in some areas it can be the main driver of symptoms, with high sensitisation rates.
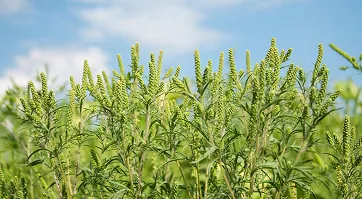
Late summer and autumn are typically associated with mugwort and ragweed pollen. Mugwort is native to Europe and widely distributed, while ragweed is an invasive species that is spreading, especially in central and south-eastern Europe. Ragweed pollen is among the most potent aeroallergens and is often linked to severe allergic symptoms and asthma exacerbations. Sensitisation rates to ragweed pollen in Europe vary markedly by region, with some national estimates in the ~10–20% range (e.g., ~16% in Germany). These late-season allergens can extend the pollen season well into autumn.
How is a pollen forecast produced?
In simplified terms, producing a pollen forecast can be broken down into a few key steps that together determine the resulting pollen concentrations in the air. First, emissions are estimated, that is, the spatio-temporal pattern of pollen release. Next comes atmospheric transport, dispersion, and deposition to the surface. Finally, the forecast is evaluated by comparing it with observations.
The individual operational models in the CAMS system may differ in how they numerically solve transport (also known as advection) and deposition, but the emission schemes are, to some extent, harmonised and coordinated across the system.
How does the model estimate pollen emissions?
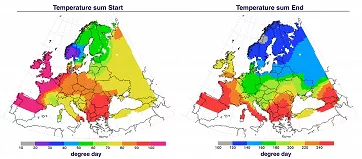
In the model, the pollen season is not determined by real-world plant development, but by the accumulation of temperature above a threshold, expressed as temperature sums (degree days). The CAMS system uses two degree-day thresholds. Once the accumulated temperature sum exceeds the first threshold, the season starts. After the second threshold is reached, the season is considered to have ended.
The threshold values are derived from real-world measurements. However, these measurements are not ingested into the model operationally every day; instead, they are used retrospectively for validation and, if needed, for tuning parameters (such as the degree-day thresholds) during calibration. The operational forecast, therefore, relies on the meteorological forecast and predefined, calibrated parameters.
Because in reality the season does not start abruptly, the model applies a gradual, probabilistic ramp-up and ramp-down of emissions. As the temperature sum increases, an increasingly larger fraction of the seasonal pollen reservoir is released.
Next, an emission flux is calculated for each grid cell, that is, the amount of pollen released into the air at a given moment (the number of pollen grains released per unit area per unit time). This requires input data on the distribution of individual pollen types (alder, birch, grasses, etc.) in the landscape and on their production potential.
How much pollen is actually released on a given day depends on the current weather. Emissions are therefore adjusted based on meteorological conditions. Rain and high humidity suppress release (pollen becomes moist and remains on the plant), whereas wind and turbulence enhance it by mechanically liberating pollen into the air. The wind effect is capped so that under very strong winds, emissions do not increase without limit but instead gradually level off.
At the same time, information on production potential is used to determine how much pollen is available for a given pollen type and season in a given area (the seasonal reservoir). Once this reservoir is depleted, pollen is no longer released, even if, according to the temperature thresholds, the season has not yet formally ended.
The output of the emission module is the pollen emission flux at each grid point and time step.
What controls pollen transport in the atmosphere?
After emission, transport determines how pollen is distributed in the atmosphere. In the model, pollen is treated as a chemically inert particle, meaning it does not undergo chemical changes. It is carried horizontally by the wind (advection) and mixed within the atmospheric boundary layer by turbulence, which drives both vertical and horizontal dispersion. Turbulent mixing is often enhanced by convection, especially during daytime surface heating, when updrafts and downdrafts distribute pollen more efficiently across different heights. Transport is therefore mainly governed by meteorological conditions, such as the wind field, atmospheric stability, and the depth of the boundary layer.
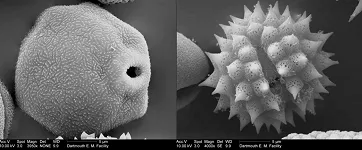
In parallel, pollen is removed from the air by deposition. Dry deposition includes gravitational settling as well as turbulent impaction and interception on surfaces. For example, birch pollen typically has a settling velocity of a few centimetres per second.
Wet deposition is also very important, namely, precipitation scavenging within and below clouds. Precipitation has a major impact on pollen concentrations, and even relatively small rainfall amounts can substantially reduce airborne pollen levels.
Generation of the individual forecasts
By combining emissions, transport, and deposition, each of the 11 European chemical transport models produces its own forecast of pollen concentrations across the grid and over time, expressed in pollen grains per cubic metre.
These individual outputs are then combined into a single representative ensemble product, usually computed as the median value at each grid point.
This ensemble approach improves forecast stability and reliability by reducing the influence of extreme errors from individual models and by blending their different representations of emissions, transport, and deposition into a more robust result.
Are pollen concentration forecasts compared with real-world conditions?
The final and crucial step in producing a pollen forecast is validation. Modelled pollen concentrations are retrospectively compared with real measurements from aerobiological monitoring stations of the European Aeroallergen Network (EAN). The evaluation considers, for example, overall forecast error, systematic bias, and whether the model correctly captures the onset of the season, its development, and peak concentrations.
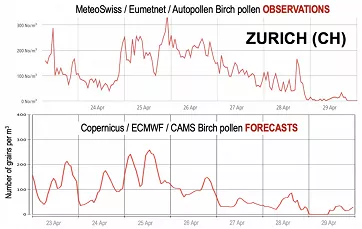
The EAN is a pan-European database of pollen and fungal spore measurements. Operating since 1988, it now includes data from more than 600 stations in 38 countries. It serves as a central platform for collecting, standardising, and sharing both long-term and near-real-time pollen data from national networks and laboratories.
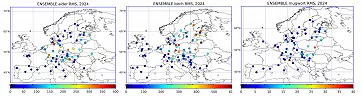
These data allow continuous assessment of model performance and the identification of weaknesses. Validation results support further model development and are used to adjust parameters and schemes in subsequent versions, including phenological thresholds, temperature sensitivity, the influence of humidity and precipitation, and source maps. In this way, forecasts can be progressively refined in future seasons, both at the level of individual models and of the overall ensemble product.
Pollen forecast on Windy.com
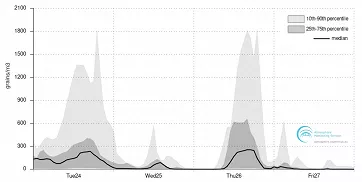
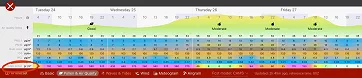
On Windy.com, you can view CAMS pollen forecasts in the detailed forecast for a specific location by switching to Pollen & Air Quality. If higher pollen levels are expected over the next four days, the chart will show the forecast concentrations for the relevant pollen types. The displayed value represents the CAMS ensemble median.
Pollen is shown alongside air quality to better assess the overall allergy load. Air pollution can worsen symptoms and, in some cases, interact with pollen grains to increase their allergenic potential. Pollutants such as particulate matter (PM₁₀ and PM₂.₅), ozone (O₃), nitrogen dioxide (NO₂), and sulfur dioxide (SO₂) can lead to more intense reactions than pollen alone. As a result, days with high pollen combined with poor air quality can feel more challenging than high-pollen days with cleaner air.


Comments (2)