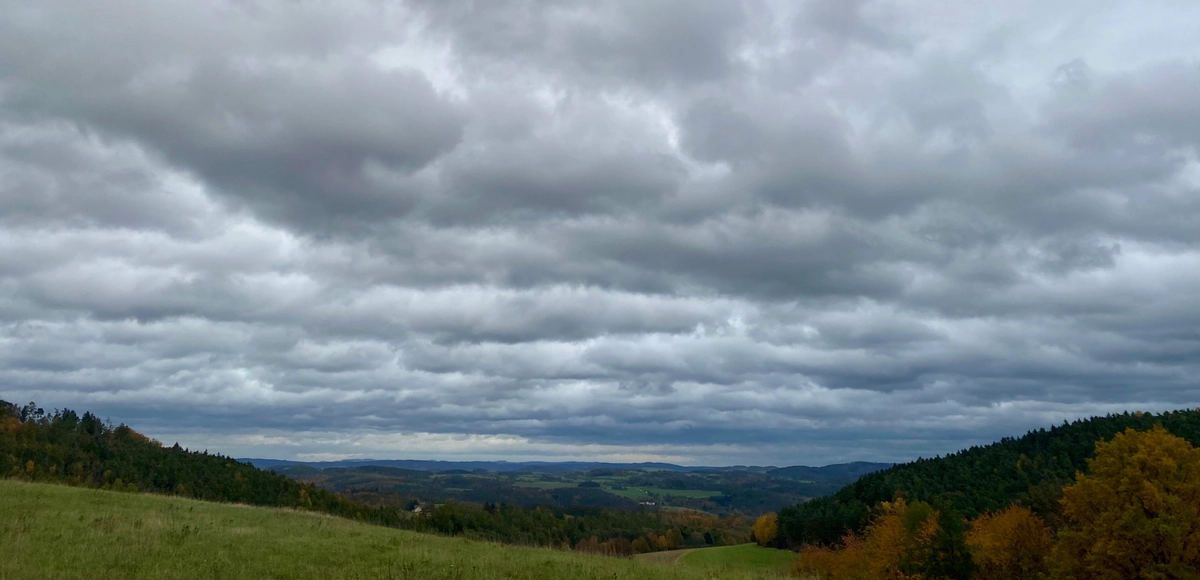
With the arrival of spring in the Northern Hemisphere, the Sun climbs higher above the horizon day by day. Its rays bring increasing amounts of energy to the Earth’s surface, and the landscape gradually warms. As the surface heats up, it also warms the air above it, allowing thermals to form.
Astronomical spring (Northern Hemisphere) and autumn (Southern Hemisphere) began on 20 March 2026 at 10:01 UTC
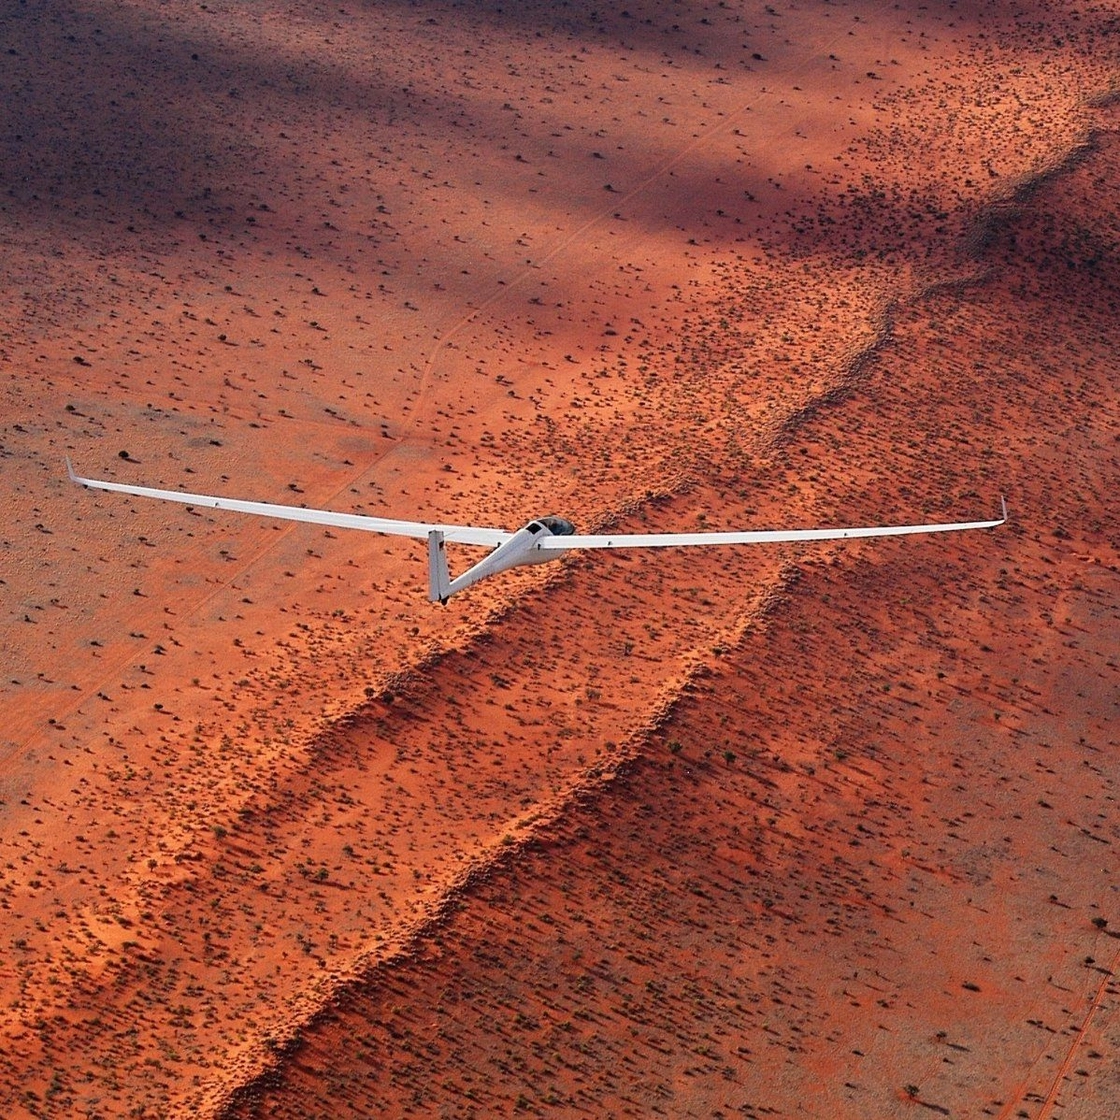
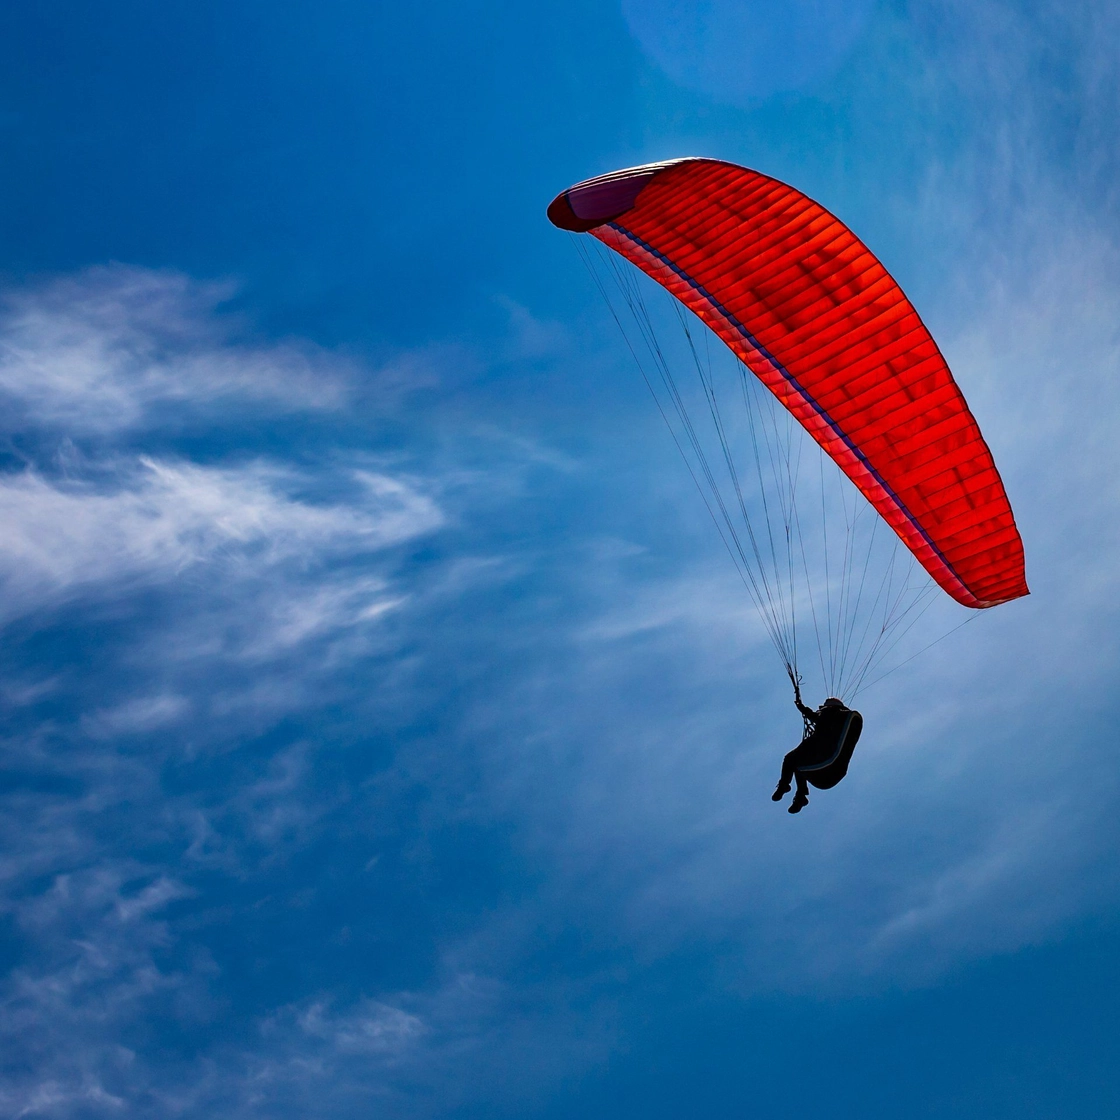
Thermals make unpowered flight possible, allowing a glider or paraglider to gain altitude and convert it into forward flight.
In this article, we take a simplified look at how thermals form, what influences their development, and how to interpret atmospheric soundings. We also briefly introduce boundary-layer meteorology, the branch of meteorology that studies the lowest part of the atmosphere and its interaction with the Earth’s surface.
What Are Thermals?
Thermals are rising currents of warm air produced by thermal convection, one of the fundamental mechanisms by which heat is transferred from the Earth’s surface to higher layers of the atmosphere. They are accompanied by compensating downward motions and the development of turbulent eddies.
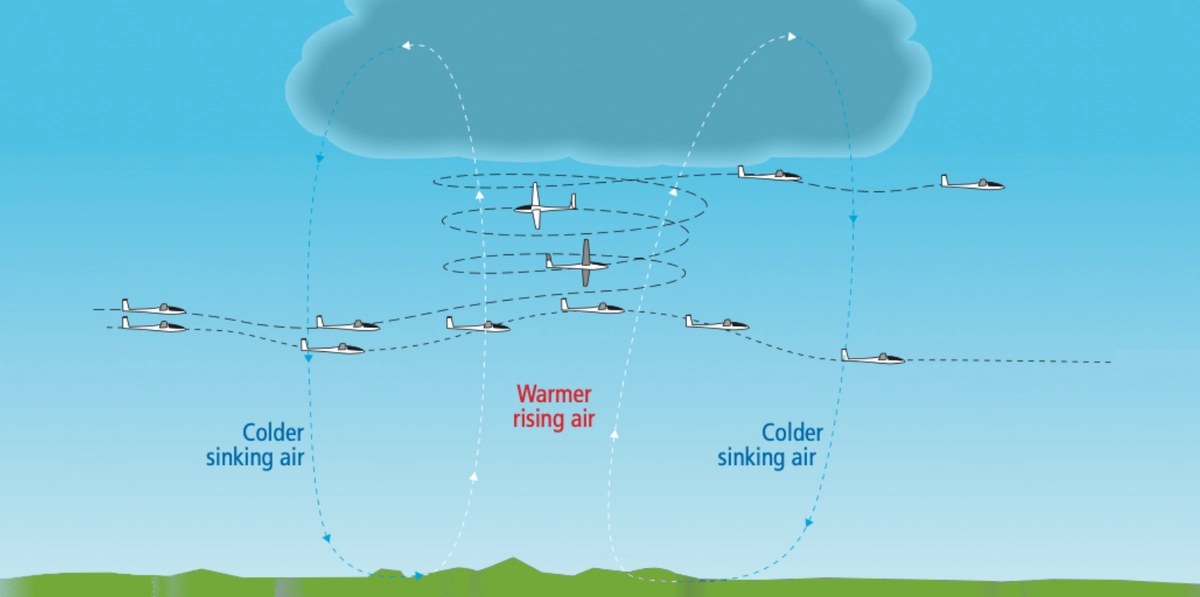
Thermals, compensating descending currents, and their effect on flight; gliding.world
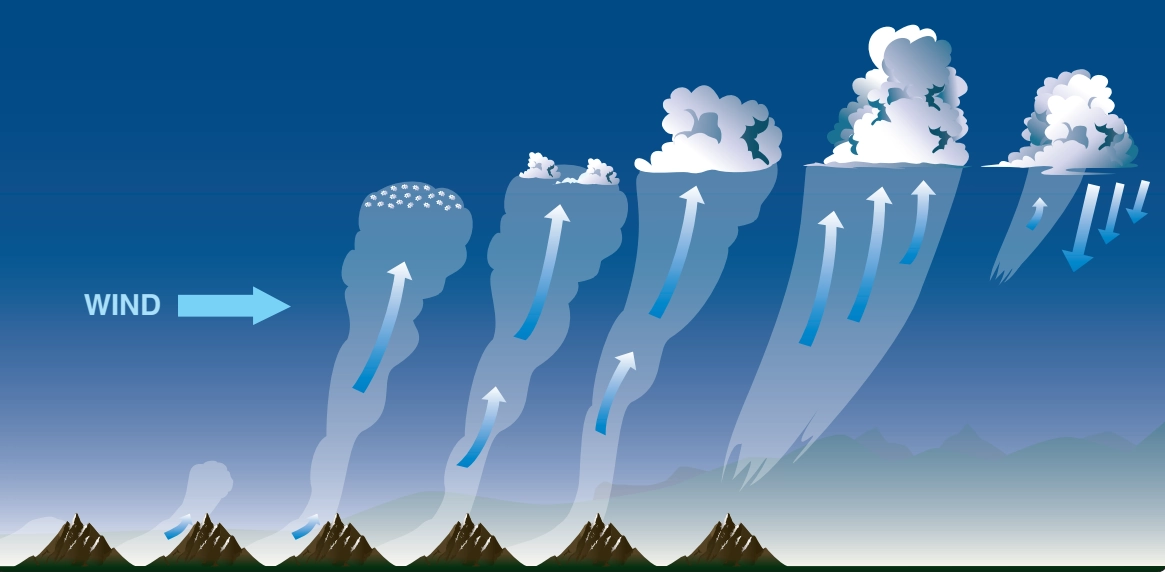
A thermal can be described as a bubble or column of warm air that detaches from the ground and begins to rise. As it ascends, it expands, becomes more turbulent, and is carried along by the wind. Smaller bubbles may gradually merge to form a well-developed rising current. At roughly 100 to 200 m above the ground, a thermal may already take the form of a usable updraft.
Formation of thermals; Met Office
The typical vertical velocity of a rising current is around 1 to 3 m/s. The duration of an individual updraft is not fixed. In weak conditions, it may last only a few seconds; in well-developed and organised thermals, it may persist for ten to twenty minutes. In addition, thermals may repeatedly form above the same favourable source area.
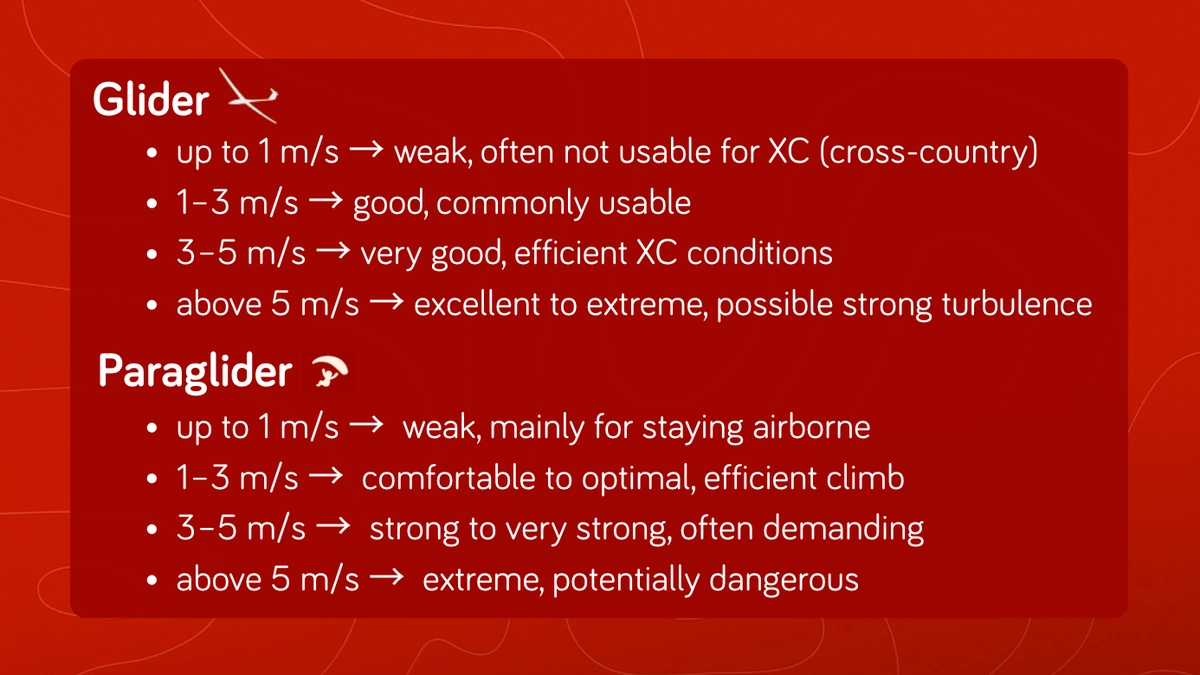
Updraft speeds and their impact on gliders and paragliders; SSA, MosAiles.com
If the air contains enough moisture, a cumulus cloud forms at the top of the thermal. Otherwise, the thermal remains cloudless and invisible.
As rising air cools, it eventually matches the surrounding temperature, buoyancy weakens, and the upward motion gradually stops, usually near the top of the boundary layer.
Monthly solar insolation maps from CERES data, July 2006–September 2013; NASA
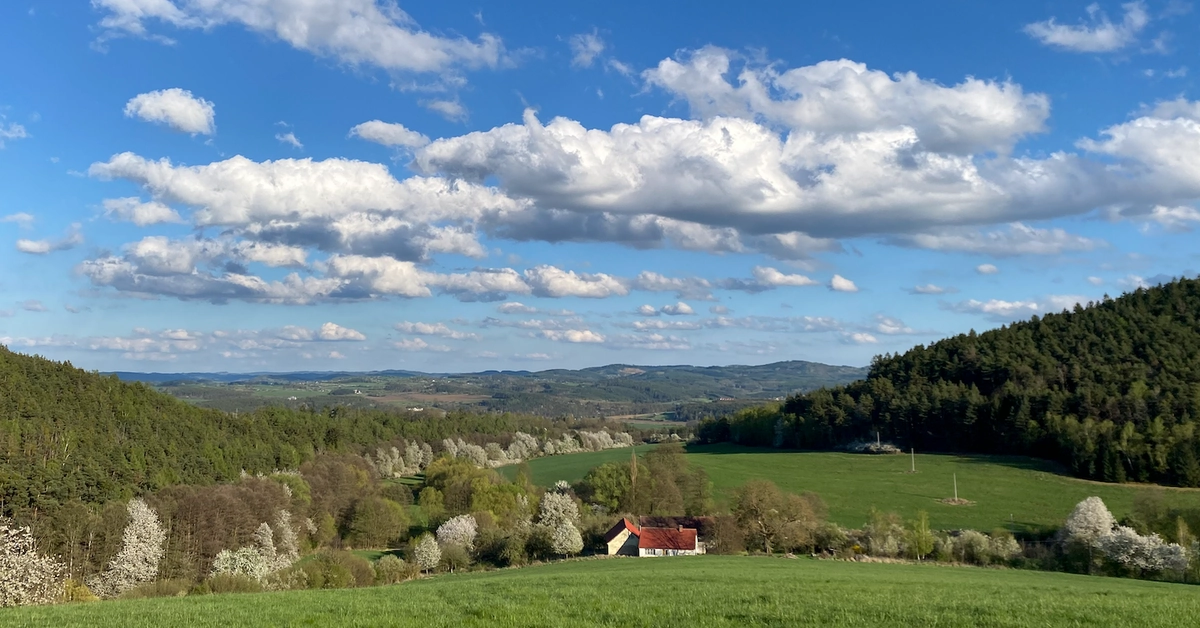
The properties of the Earth’s surface also play an important role. Different surface types heat up at different rates. Dark and dry surfaces, such as ploughed fields, asphalt, rocky terrain, and deserts, tend to heat strongly and promote thermal development.
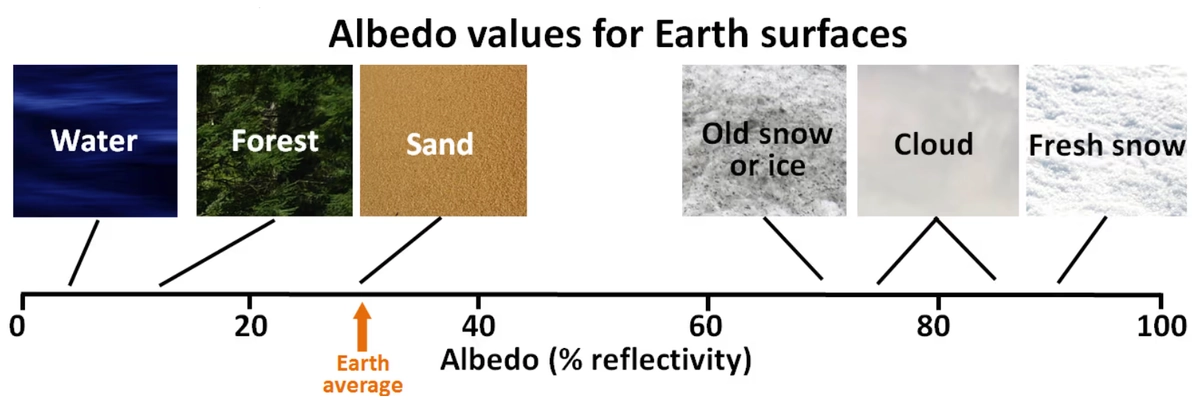
Albedo measures surface reflectivity: low values mean more absorption and stronger heating, high values more reflection and less warming; Physical Geology
A damp or wet surface uses a significant part of the incoming energy for the evaporation of water and therefore warms more slowly than a dry surface, making conditions for thermal development less favourable. A typical example is bodies of water, above which areas of weak or no thermals often form.
Cross-country soaring; SSA
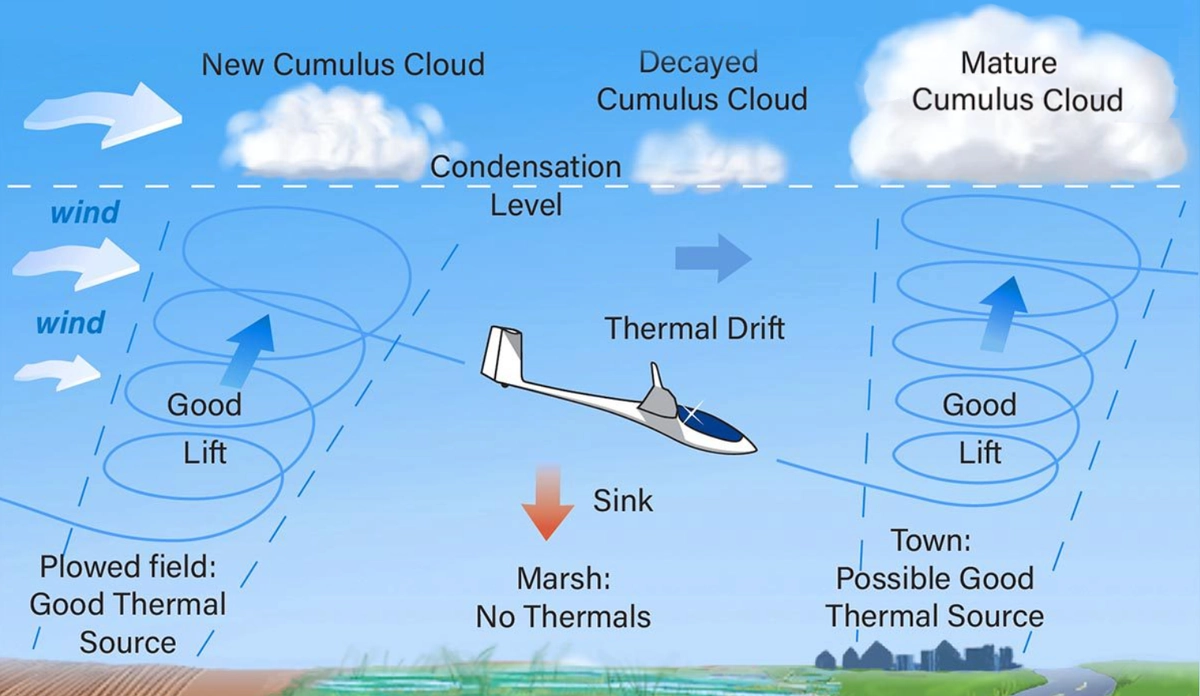
Landscape diversity is also important for thermal development. A mosaic of fields, forests, urban areas, and slopes creates better conditions than uniform terrain. Contrasts between surfaces that heat at different rates create temperature differences, and thermals are often strongest along their boundaries.
Trigger
Even if the air near the ground is heated, this does not necessarily mean it will start to rise. Warm air may first accumulate near the surface and form a kind of pool of warm air. To break away and rise, it needs an additional impulse.
This can be provided by a gust of wind, a topographic obstacle, a building, a passing car, the edge of a forest, or the boundary between a dry field and a moist meadow, or simply the moment when the buoyancy of the warm air becomes strong enough for the bubble to detach on its own. Once one bubble rises, its place near the ground is quickly filled by surrounding air, which warms again, and the whole process repeats. A pilot can therefore use the same area for an extended period, moving between successive thermals.
Thermals can form as bubbles or columns; understandingthesky.com
How often thermals detach depends, among other things, on the strength and direction of the wind. In calm conditions and light winds, warm air accumulates longer over a suitable surface, so thermals are released at longer intervals and tend to be wider, smoother, and longer-lasting, typically several minutes, often around 5 to 20 minutes. In stronger winds or with more pronounced wind shear, rising currents detach more frequently and tend to be narrower, more dynamic, and more turbulent.
Atmospheric Stability and Instability
Atmospheric stability describes whether the atmosphere, or part of it, supports vertical motions or suppresses them.
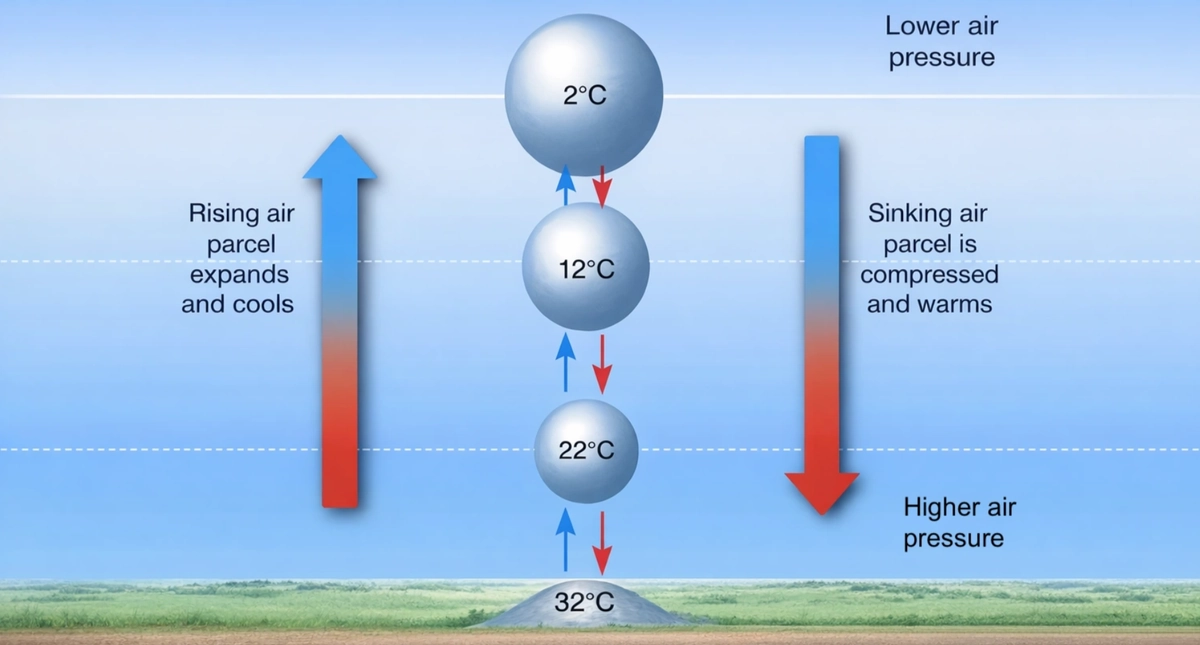
Schematic diagram of rising and sinking air parcels; Climate Water Project
As an air parcel rises, it enters regions of lower pressure, expands, and cools. If it is not saturated with water vapour, it cools dry adiabatically at about 10 °C/km. If it is saturated, it cools more slowly because latent heat is released during condensation. Depending on moisture content, the moist adiabatic lapse rate ranges roughly from 4 °C/km to nearly 9.8 °C/km, with an average around 6 °C/km.
Whether an air parcel will continue to rise on its own depends on the temperature of the surrounding air. If the surrounding air cools more rapidly with height than the parcel, the parcel remains warmer, has a lower density, and buoyancy carries it upward. Such a temperature structure is called unstable and is favourable for thermal development. Excellent thermal conditions often occur when the landscape is well heated and cooler air is present aloft, for example behind a cold front.
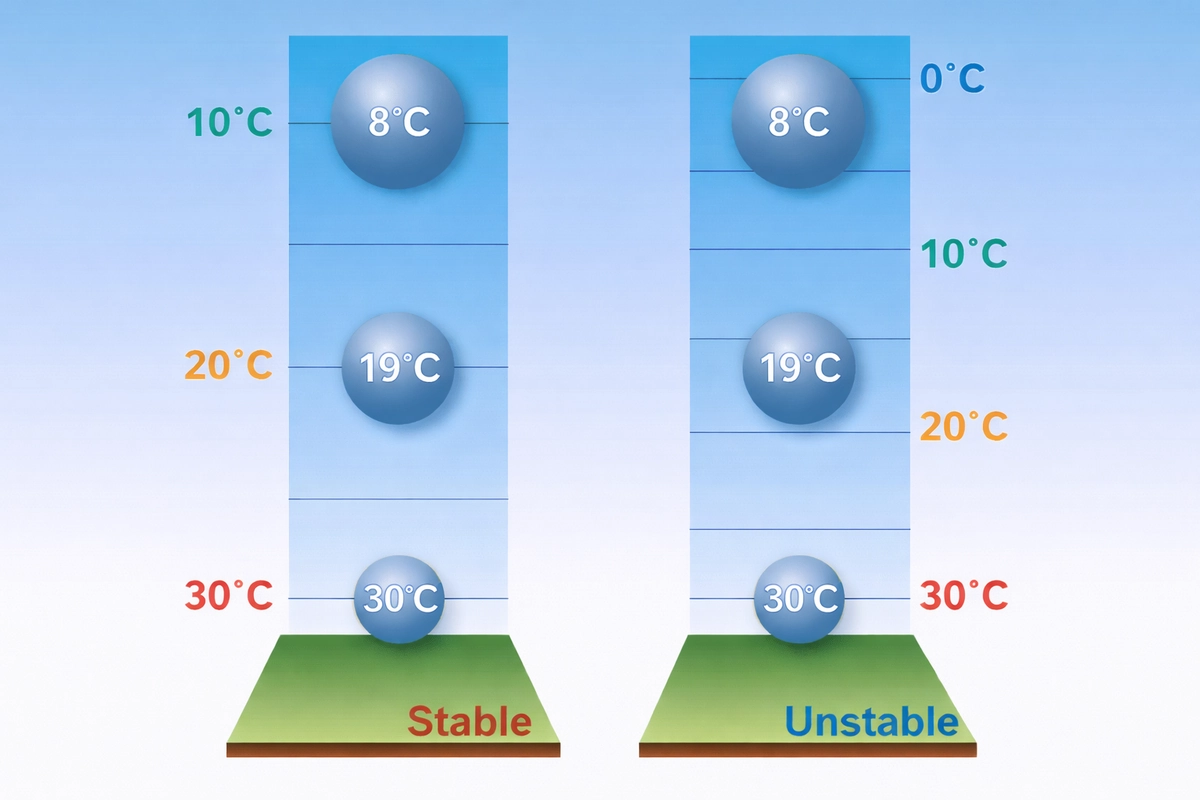
Stable temperature stratification suppresses vertical motion, while unstable stratification promotes it; NOAA Jet Stream
By contrast, if temperature decreases only slowly with height, or even increases with height, as in an inversion, the temperature structure is stable. A rising air parcel then cools sufficiently to become colder than the surrounding air, so its upward motion slows, stops, and may eventually begin to sink.
How strongly a stable layer in the higher parts of the atmosphere affects an already developed thermal current depends mainly on the strength of the updraft and the layer’s thickness. If the layer is only thin, a stronger current may pass through it and continue to rise, although it may slow somewhat in the process.
During anticyclonic weather, conditions for thermal development are often favourable. Sometimes, however, thermals remain weak despite sunny weather and strong surface heating, and do not rise high enough for soaring. This is due to stable stratification. In the centre of a high-pressure system, stability may be further enhanced by sinking air.
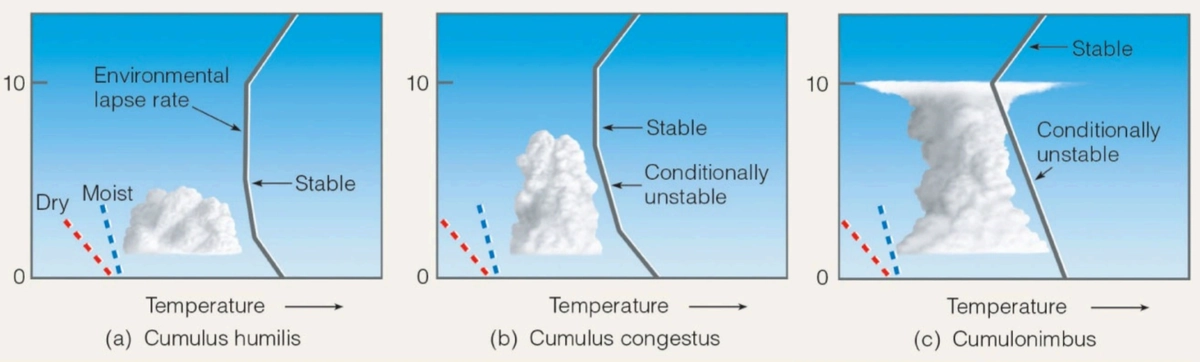
Stability/instability in the atmosphere and vertical extent of cloudiness: cumulus humilis, cumulus congestus, and cumulonimbus; Cengage 2012 via atoc.colorado.edu
If temperature decreases with height more slowly than 10 °C/km but faster than 6 °C/km, the atmosphere is conditionally unstable, that is, it is stable for dry air but unstable for moist air. Such conditions are favourable for thunderstorm development.
The Atmospheric Boundary Layer and Its Development
The atmospheric boundary layer is the lowest part of the troposphere, strongly influenced by the Earth’s surface, especially by friction, heating, cooling, and turbulence. Its depth varies greatly in both space and time. At night, it may be only a few metres thick, while during the day it commonly grows to 2 km, and sometimes even more.
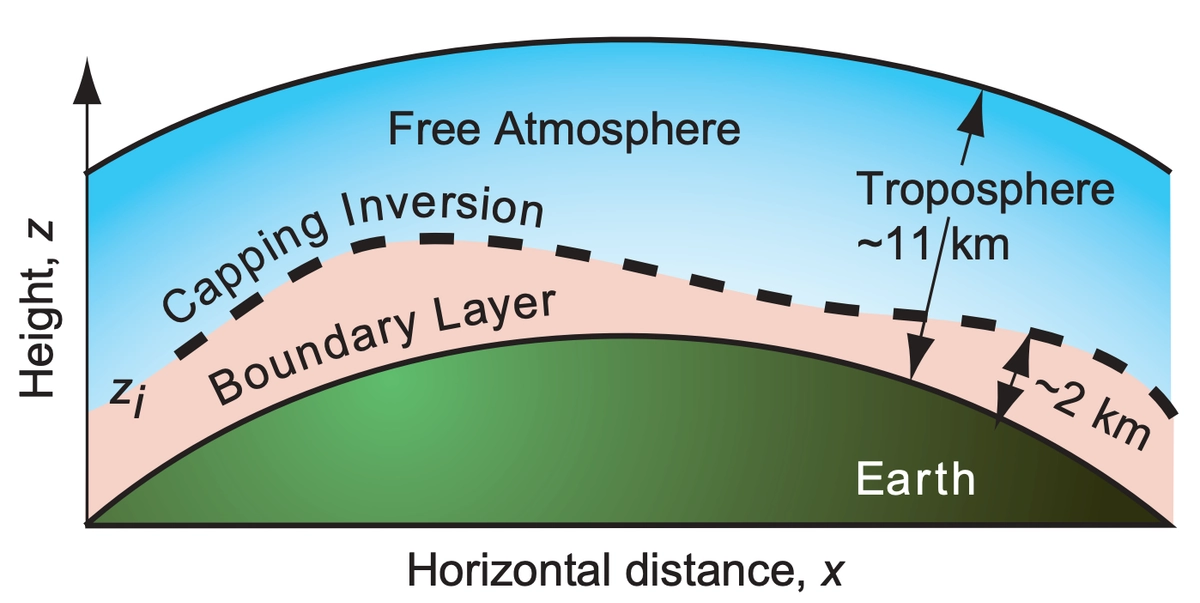
Vertical cross section of the troposphere: the boundary layer near the ground and the free atmosphere above; Meteorology for Scientists and Engineers via Atmospheric Science: An introductory survey
Above the boundary layer lies the free atmosphere, where the influence of the Earth’s surface is negligible and airflow is controlled mainly by large-scale dynamics. The boundary between the boundary layer and the free atmosphere is often formed by a stable transition layer or a capping inversion, which limits vertical mixing between the boundary layer and the free atmosphere.
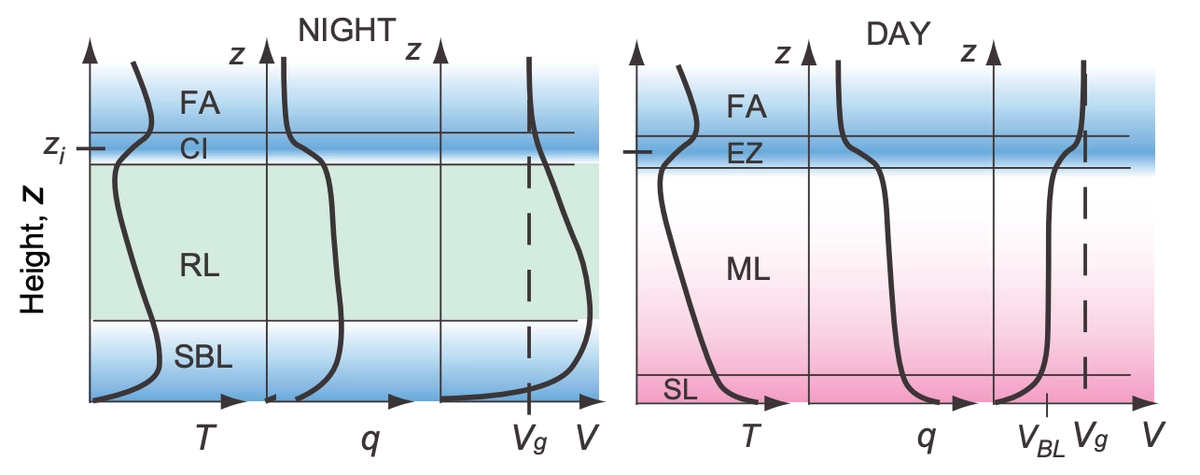
The boundary-layer height (zᵢ) is marked by abrupt changes in meteorological variables (T = temperature, q = specific humidity, V = wind, Vg = geostrophic wind), making it clearly visible in the diagram; Meteorology for Scientists and Engineers via Atmospheric Science: An introductory survey
The typical daily evolution of the boundary layer and thermals occurs when the air mass remains the same and the boundary layer is influenced mainly by the daily cycle of radiative heating and cooling of the Earth’s surface.
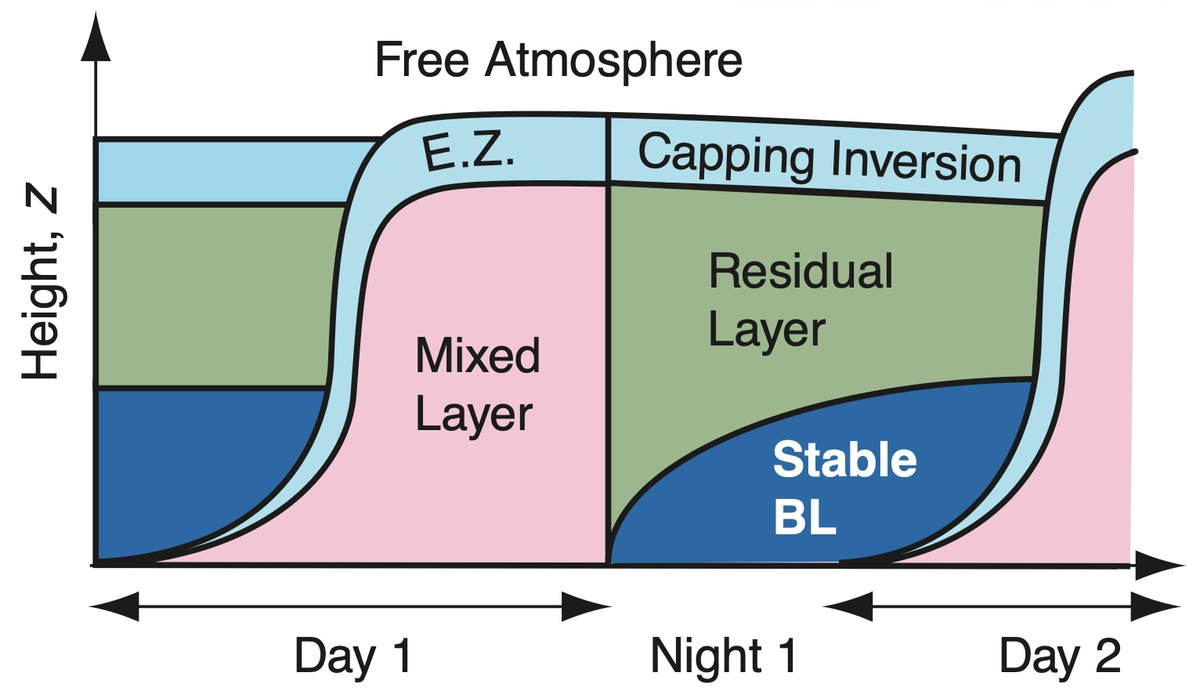
Boundary-layer structure and its typical summer evolution over land in fair-weather, clear-sky conditions; Meteorology for Scientists and Engineers via Atmospheric Science: An introductory survey
Toward the end of the night, a temperature inversion caused by nocturnal surface cooling is usually present near the ground. After sunrise, the surface begins to warm again, along with the air just above it. The first shallow thermals begin to form, disrupting the nocturnal inversion and starting to mix the lower part of the atmosphere. At the same time, entrainment takes place at the top of the boundary layer, meaning that air from the free atmosphere is mixed into it. As a result, the mixed layer gradually deepens during the day, the nocturnal inversion disappears, and the layer grows upward. Its upper boundary roughly indicates the maximum height of daytime thermals.
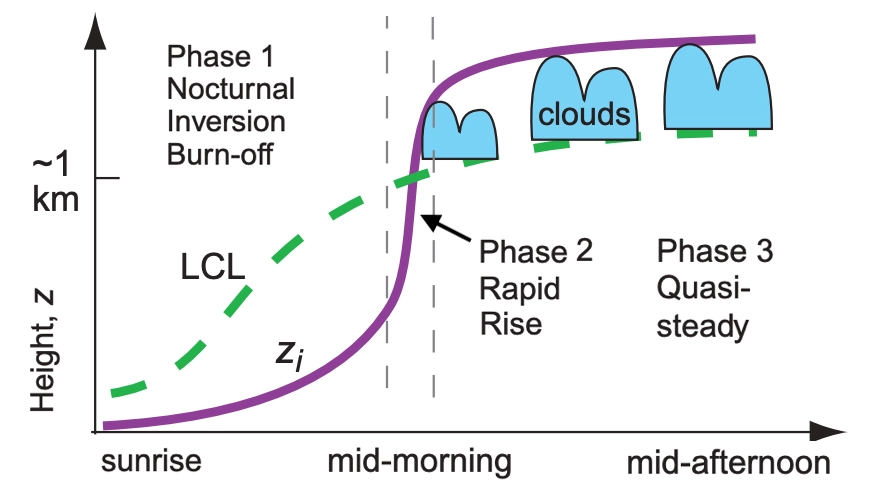
The height of the boundary layer zᵢ during the day over land in fair weather defines how high thermals can rise. If water vapour condenses during ascent, cumulus clouds form. Meteorology for Scientists and Engineers via Atmospheric Science: An introductory survey
In the morning hours, the boundary layer develops only slowly and thermals are still weak and shallow. Later in the morning, after the nocturnal inversion breaks down, the boundary layer enters a phase of rapid growth, thermals strengthen, and rising currents reach greater heights. Once the boundary layer has deepened sufficiently and the surface has warmed to the convective temperature, thermals may reach the condensation level and cumulus clouds begin to form. The afternoon and early evening therefore often offer the best thermal conditions for soaring.
Toward evening, solar heating weakens, the surface begins to cool, and thermals gradually disappear. Turbulence decreases, and a stable nocturnal boundary layer forms again near the ground. In calm weather, this daily cycle repeats the next day.
The passage of an atmospheric front strongly disrupts this typical development, because advection of a different air mass alters the structure of the boundary layer.
How to Recognize Thermals in the Field
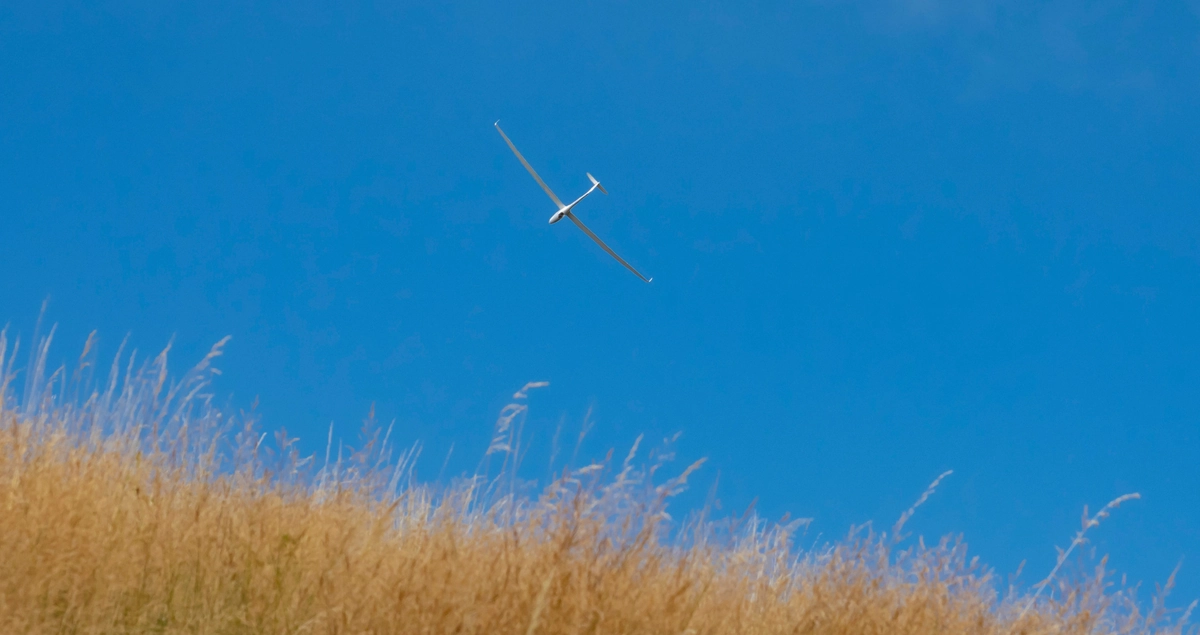
Thermals are most clearly revealed by small to medium-sized, sharply defined cumulus clouds with active vertical growth and only partial sky cover.

Cumulus humilis (pictured) and cumulus mediocris indicate thermals
The base of an active cumulus cloud is often slightly concave. This is because the centre of the rising current contains the warmest air, in which water vapour condenses last, and therefore at the highest level.
A rapidly developing cumulus cloud does indicate stronger lift, but it is also accompanied by stronger downdrafts and a more vigorous overall thermal circulation.

Towering cumulus clouds
During rapid thermal development, it is sometimes possible to observe neighbouring cumulus clouds with different base heights. A smaller cumulus may even begin to form beneath an already existing one. This is often a sign that thermals are detaching frequently above the same source area.
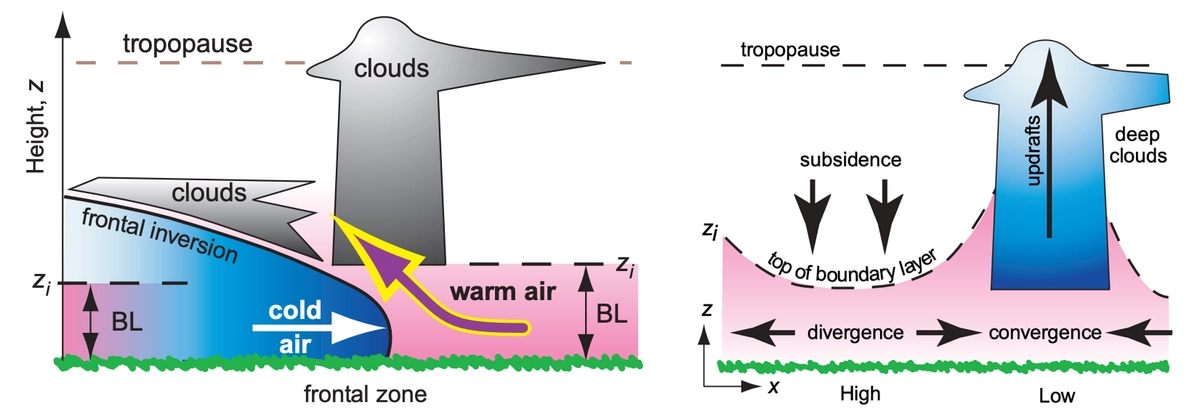
The boundary layer during the passage of a cold front and a thunderstorm; Meteorology for Scientists and Engineers via Atmospheric Science: An introductory survey
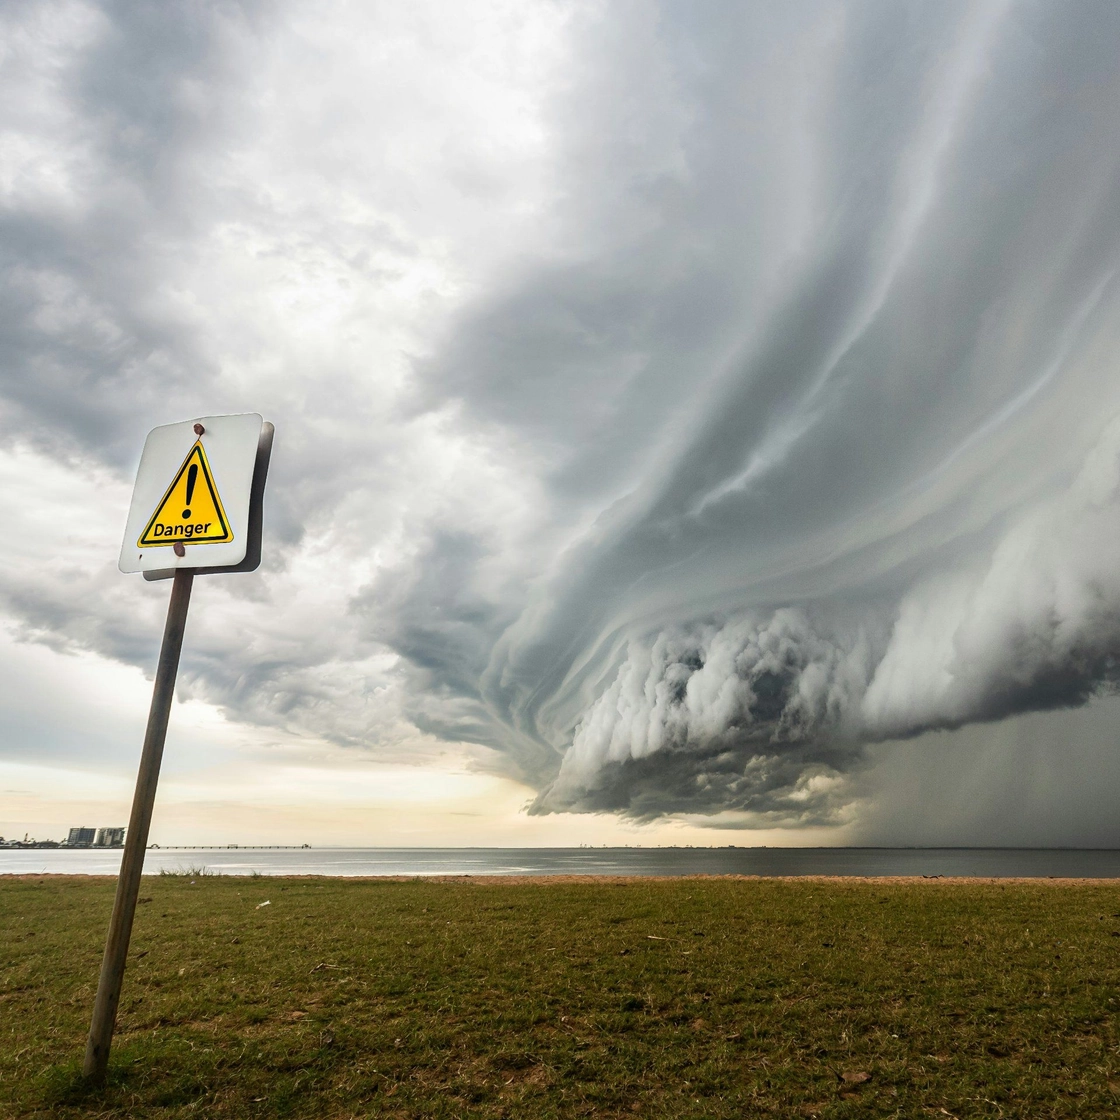
If cumulus clouds grow into deep convective clouds and air-mass thunderstorms become likely, conditions for thermal flying are usually no longer good. In the boundary layer, heat and moisture often accumulate beneath an inversion that limits its growth and entrainment, so thermals remain weak and poorly organized for a long time. Once the inversion is broken, the energy is rapidly released into strong thunderstorm updrafts, while outside them thermals tend to be weaker and less usable. At the same time, the risk of turbulence, downdrafts, and cold outflows increases, making such conditions unsuitable and hazardous for soaring.
Cloudless thermals
Cloudless thermals are harder for a pilot to read. Rising currents must then be estimated from the character and shape of the landscape, while also taking into account the airflow that carries the thermal along. As a result, the rising current is usually not located directly above its source area, but is shifted downwind. In cloudless thermal conditions, rising currents are generally narrower, more widely spaced, and harder to locate than when cumulus clouds are developing.
On the other hand, one advantage may be the possibility of reaching greater altitudes, because the pilot is limited not by cloud base, but only by aviation regulations.
How to Read Thermals from a Sounding
Changes in the properties of the atmosphere with height are derived from radiosonde observations. Measured data on temperature, humidity, pressure, and wind are displayed on a thermodynamic diagram, most often in the form of a Skew-T log-P diagram, in which the isotherms are tilted at an angle of about 45°.
Skew-T Log P diagram; NOAA Jet Stream
Sounding analysis helps us estimate whether thermals will form at all, how strong they will be, whether they will be cloud-forming or cloudless, organized or broken, and whether there is a risk of transition to thunderstorms.
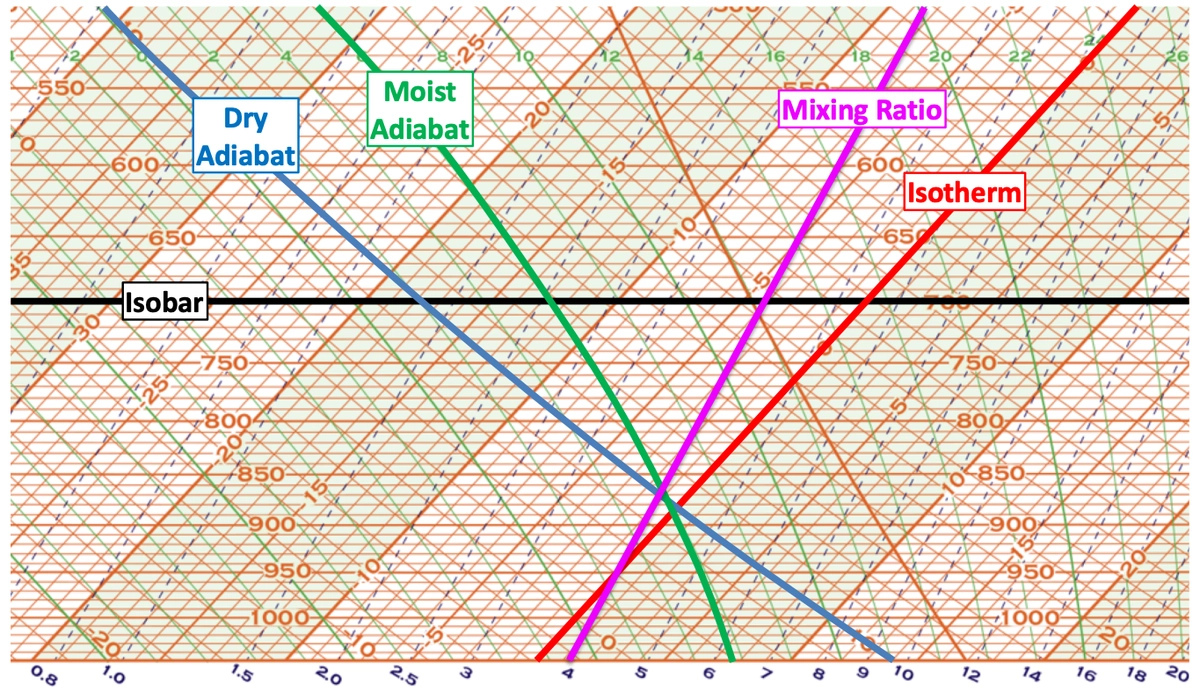
Skew-T Log P diagram: key lines; inscc.utah.edu
On the thermodynamic diagram, air temperature is plotted in red and dew point temperature in blue (sometimes green). When these curves lie close together at certain levels, it indicates higher relative humidity and a higher likelihood of cloud formation.
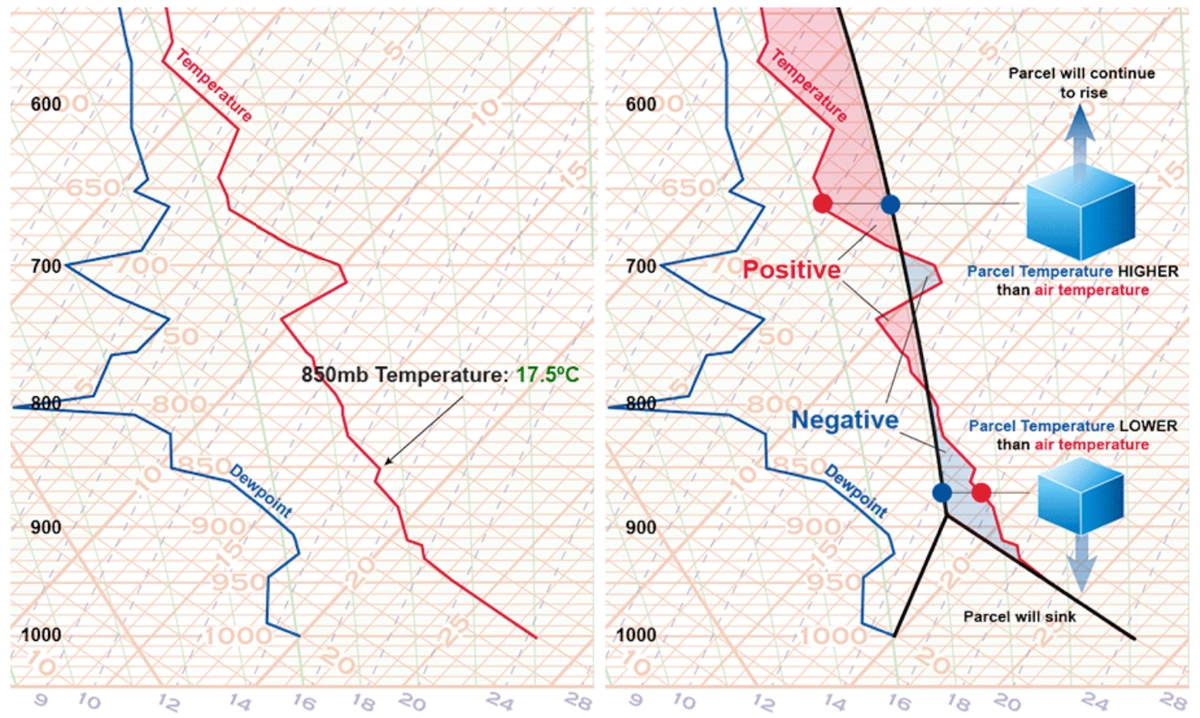
One of the primary functions of a thermodynamic diagram is to determine atmospheric stability; NOAA Jet Stream
Atmospheric stability is determined by comparing the environmental temperature lapse rate with the dry and moist adiabats (see Atmospheric Stability and Instability). If temperature decreases with height more rapidly than along a dry adiabat, the stratification is unstable; if it decreases more slowly than along a moist adiabat, it is stable. If it lies between the two, the atmosphere is conditionally unstable.
Atmospheric stability (stable, conditionally unstable, and unstable) on a Skew-T diagram; inscc.utah.edu
Using the parcel method, we can determine the lifting condensation level (LCL), that is, the height at which water vapour begins to condense during forced ascent of an air parcel, for example when air flows over a mountain barrier, and starts to form a cloud base. On the diagram, it is determined as the intersection of the dry adiabat drawn from the surface air temperature of the parcel and the mixing ratio line drawn from the surface dew point.
One of the most important quantities for both glider pilots and paraglider pilots is the convective condensation level (CCL). It indicates the approximate height at which thermal currents begin to produce cumulus clouds. On the diagram, it is determined as the intersection of the mixing ratio line drawn from the surface dew point and the atmospheric temperature profile.
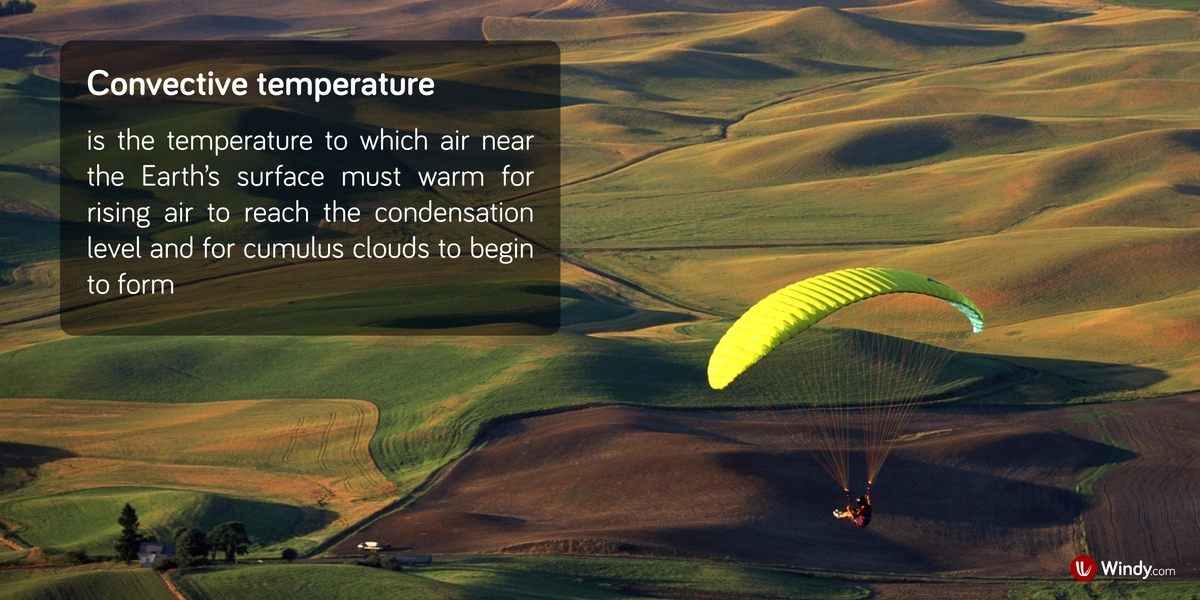
If we trace downward on the diagram from the CCL to the ground along a dry adiabat, we obtain the convective temperature (Tcon, CT; see The Atmospheric Boundary Layer and Its Development). By comparing it with the forecast maximum daytime temperature, we can estimate whether cumulus cloud formation can be expected during the day and roughly when it will begin.
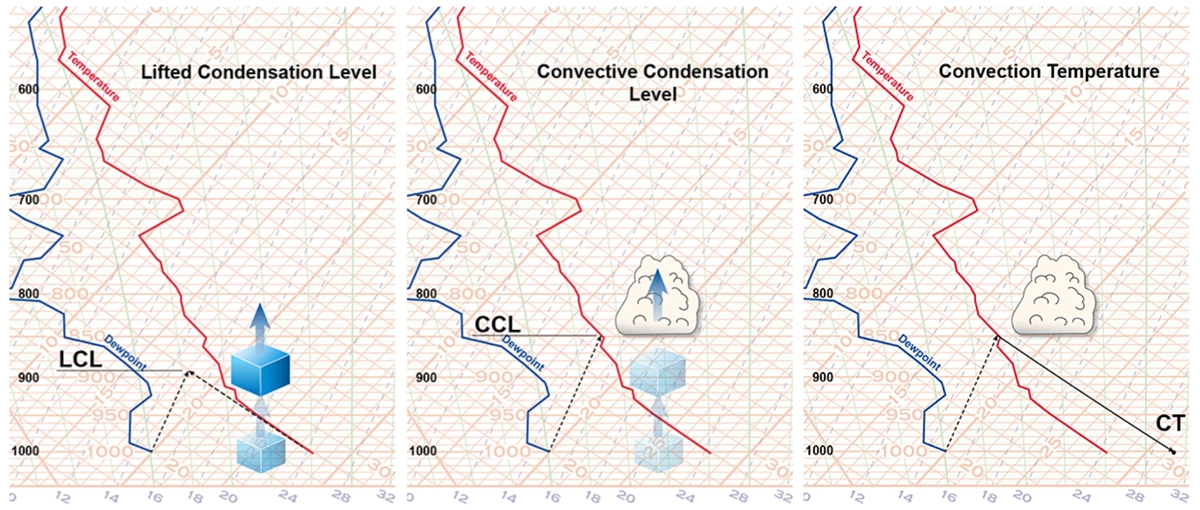
The parcel method is used to determine the characteristic levels in the diagram; NOAA Jet Stream
The strength of rising currents can also be estimated from a sounding. The greater the difference between the temperature of the rising air parcel and that of the surrounding environment, the stronger the thermals tend to be. If the temperature profile in the boundary layer is close to a dry adiabat, thermals are usually well developed and organized.
It is also possible to estimate the formation of a more continuous stratocumulus layer, often referred to as “overdevelopment” (OD) by glider pilots. If an inversion is present at the level of the expected cumulus tops, that is, near the top of the boundary layer, and if air temperature and dew point are close together there, the tops of cumulus clouds may begin to spread sideways and form a more continuous cloud layer.
A continuous stratocumulus layer reduces solar heating at the surface. This, in turn, limits further thermal development
The degree of thermal organization can also be estimated from the wind profile with height. In light winds and weak shear, rising currents tend to be broader, smoother, and easier to use. In stronger winds or with pronounced wind shear, thermals break up and tend to become narrower, more broken, and more turbulent.
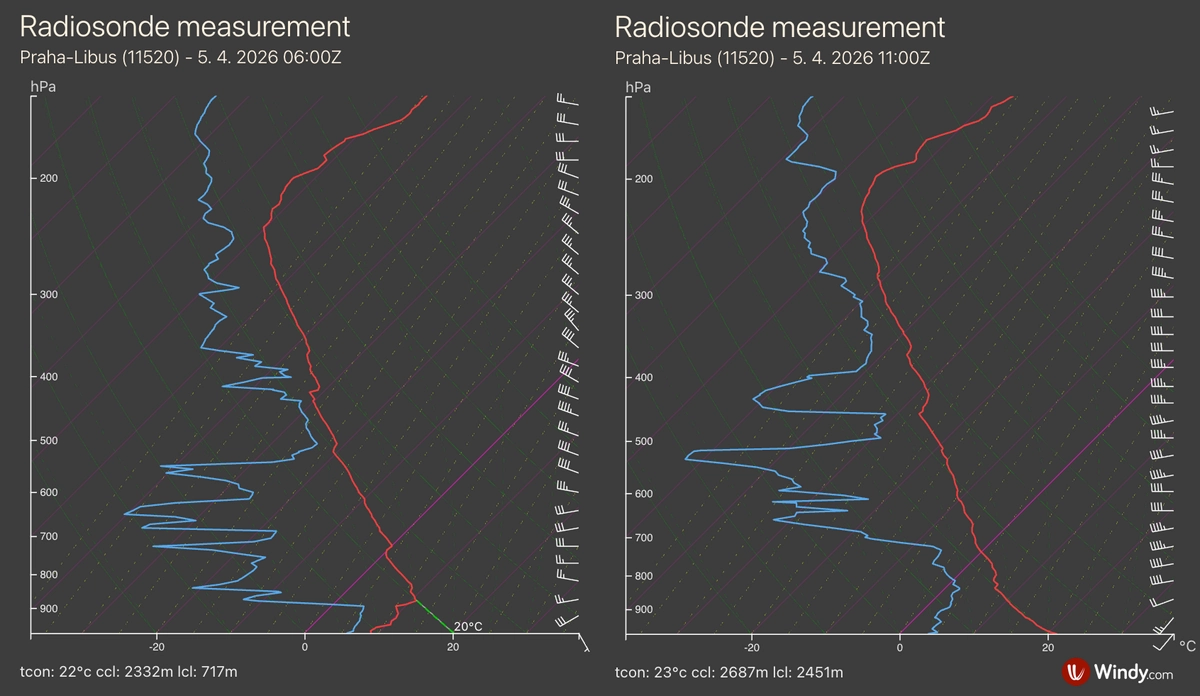
Morning sounding with a simple estimate of the afternoon temperature profile (left, green line), and noon sounding (right)
Before flying, we usually work with a nighttime or morning sounding. Near the surface, it often shows a nocturnal inversion, which usually gradually disappears during the morning (see The Atmospheric Boundary Layer and Its Development). The approximate midday temperature profile after the inversion breaks down can be estimated by drawing the temperature curve from the top of the morning inversion down toward the ground along a dry adiabat. This gives the expected temperature profile in the mixed boundary layer.
Much more information can be derived from a sounding. For example, it can reveal cloud layers and their character, assess thunderstorm potential, indicate frontal boundaries, suggest precipitation type, and identify layers where icing is possible.
Thermals on Windy.com
Windy offers several useful tools for estimating thermals, allowing users to follow the situation from the synoptic scale down to the detailed behaviour of the atmosphere over a specific location.
A basic overview can already be obtained from the synoptic situation itself and its evolution. As already mentioned, the best conditions for thermals usually occur when there is plenty of sunshine, relatively dry air, and at least slightly unstable atmospheric stratification. Such situations are typically associated with high-pressure systems or periods following the passage of a cold front. On Windy, these conditions can be monitored well using mean sea-level pressure, temperature at 850 hPa, humidity at different levels, wind fields, and other parameters.
For gliding and paragliding, the Thermals layer is especially useful. It forecasts the height of the convective condensation level (CCL) and the likely development of cumulus clouds, from small cumulus clouds to extensive cloudiness or even thunderstorms. The calculation combines surface conditions with the vertical structure of the atmosphere, including temperature and dew point near the ground and aloft, terrain height, surface heat flux, wind, precipitation, thunderstorms, and the position of the Sun.
Atmospheric soundings available on Windy.com, both observed and forecast, are also very valuable. Forecast soundings from numerical models clearly show how thermals are likely to develop during the day at almost any location. Important values such as LCL, CCL, and Tcon are displayed below the diagram. Thanks to the interactive display, it is easy to see how an air parcel rising from the ground will behave, at which level it will reach saturation and begin to form cloud, and whether it will remain warmer than the surrounding air.
A very practical tool for assessing vertical conditions in the atmosphere is the airgram. It clearly displays temperature, wind speed, and wind direction at different levels, together with cloudiness and precipitation. It can be displayed either as a forecast for a single location or as a vertical cross-section of the atmosphere along a selected route in Distance & Planning mode. In addition, paraglider pilots can display information for paragliding launch sites directly on the map.


Comments (32)
Especially the charts showing the atmospheric instability are very helpful to interpretate a current situation.
As my predessor mentioned, I 'd appreciate a downloadable pdf for sharing with my glider community.