
Lesser Antilles
Bridgetown
Roseau
St. John's
Road Town
Cancún
Mérida
Honduras
Belmopan
Bilwi
Nicaragua
Managua
George Town
Cuba
Caribbean Sea
Kingston
Port-au-Prince
Holguín
Cockburn Town
Dominican Republic
Guatemala
Guatemala City
Acapulco
Tuxtla Gutiérrez
Mexico City
Guadalajara
Bahamas
Nassau
Monterrey
Ciudad Victoria
Baton Rouge
Louisiana
Austin
Texas
Odessa
Hermosillo
Chihuahua City
Fresnillo
La Paz
Culiacán
Mexico
Ciudad Juárez
Gulf of Mexico
Havana
Miami
Florida
Tallahassee
Hamilton
Richmond
Washington
Harrisburg
New York
Raleigh
North Carolina
Toronto
Lake Erie
Lake Superior
Lake Huron
Lake Michigan
Wisconsin
Michigan
Lansing
Madison
Thunder Bay
Marquette
Sudbury
Rouyn-Noranda
Jefferson City
Little Rock
Jackson
Arkansas
Oklahoma
Missouri
Kansas
Dallas
Oklahoma City
Topeka
United States
Lincoln
Frankfort
Charleston
Columbus
Atlanta
Columbia
Nashville
Indianapolis
Springfield
Mississippi
Illinois
Virginia
Ohio
Kentucky
Tennessee
Indiana
Alabama
Georgia
Montgomery
Phoenix
Arizona
Moab
Gallup
New Mexico
Santa Fe
Colorado
Denver
Utah
Salt Lake City
Lamar
Lubbock
Halifax
Nova Scotia
Fredericton
Charlottetown
Newfoundland
Gulf of Saint Lawrence
New Brunswick
Maine
Quebec
Montpelier
Albany
Ottawa
Saguenay
Matane
Lake Ontario
Augusta
Boston
New York
Pennsylvania
Iowa
Minnesota
Saint Paul
Des Moines
Nebraska
Pierre
South Dakota
Bismarck
North Dakota
Hibbing
Fargo
Cheyenne
Wyoming
Pocatello
Rapid City
Havre
Billings
Montana
Helena
© OpenStreetMap contributors
Wednesday 27
  • 03
  • 06
  • 09
  • 12
  • 03
  • 06
  • 09
Thursday 28
  • 03
  • 06
  • 09
  • 12
  • 03
  • 06
  • 09
Friday 29
  • 03
  • 06
  • 09
  • 12
  • 03
  • 06
  • 09
Saturday 30
  • 03
  • 06
  • 09
  • 12
  • 03
  • 06
  • 09
Sunday 31
  • 03
  • 06
  • 09
  • 12
  • 03
  • 06
  • 09
Monday 1
  • 03
  • 06
  • 09
  • 12
  • 03
  • 06
  • 09
Tuesday 2
  • 03
  • 06
  • 09
  • 12
  • 03
  • 06
  • 09
Wednesday 3
  • 03
  • 06
  • 09
  • 12
  • 03
  • 06
  • 09
Thursday 4
  • 03
  • 06
  • 09
  • 12
  • 03
  • 06
  • 09
Friday 5
  • 03
  • 06
  • 09
  • 12
  • 03
  • 06
  • 09
Saturday 6
  • 03
  • 06
  • 09
  • 12
  • 03
  • 06
  • 09
Sunday 7
  • 03
  • 06
  • 09
  • 12
  • 03
  • 06
  • 09
Monday 8
  • 03
  • 06
  • 09
  • 12
  • 03
  • 06
  • 09
Tuesday 9
  • 03
  • 06
  • 09
  • 12
  • 03
  • 06
  • 09
Wednesday 10
  • 03
  • 06
  • 09
  • 12
  • 03
  • 06
  • 09
6 PM
Go Premium
kt051020304060
Developed with
Download App
5 helpful layers to watch heatwaves
moderate warning
5 helpful layers to watch heatwaves
-
updated 663 days ago
427
...

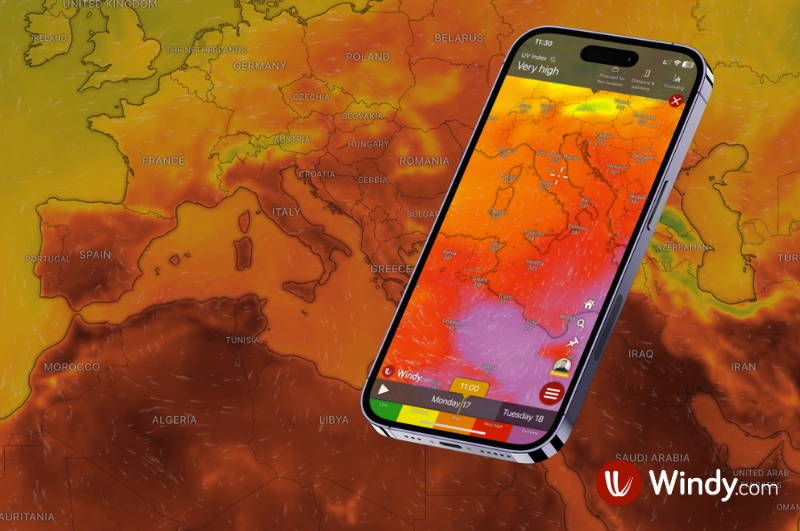
Join us to look at layers you may not be familiar with but are extremely useful in the southern hemisphere summer, namely Wet-bulb temperature (WBT), UV index, Solar Power, and Extreme forecast layers.

You can find all these layers under the group "Temperature" filter in the mobile layer menu. Drought intensity has its own filter, "Drought."

Wet-Bulb Temperature WBT

Temperature figures alone don't give a complete picture of the impact of heat on humans. So what is missing? It is the humidity that plays a significant role in how we actually experience high temperatures and how dangerous they are.

In essence, the WBT value means how well humans can cool themselves by sweating. The WBT critical threshold is considered 35 °C, where we can no longer cool down our bodies by sweating. At this temperature, human bodies switch from shedding heat to the environment to gaining heat from it.

UV index

The UV index is a fairly well-known value from general weather forecasting. But what exactly is it, and what do the different values mean? It measures the level of UV radiation at a particular place and time. The UVI indicates the level of radiation and the danger of short-term and long-term exposure to the sun.

0 to 2 means low danger from the Sun's UV rays for the average person.
3 to 5 means a moderate risk of harm from unprotected sun exposure.
6 to 7 means a high risk of harm from unprotected sun exposure.
8 to 10 means a very high risk of harm from unprotected sun exposure.
11 or more means an extreme risk of harm from unprotected sun exposure.

Solar power

The good news in the end is that the sun is also a good helper when it comes to generating electricity. Solar radiation is a form of electromagnetic radiation emitted by the sun, measured in watts per square meter (W/m2). On a clear day, the maximum surface value is approximately 1000 W/m2 at solar noon.

The Solar power layer can be used to indicate how much energy can be produced during one day with a certain amount of resources, in this case, PV panels.

Extreme Forecast

Statistically unusually cold or warm ground temperature for a given day (in UTC). ECMWF's Extreme Forecast Index, based on its 20-year history, displays the probability that on a given day, there will be an extreme event. The layer also shows unusually windy or rainy days (6 days ahead).

Drought monitoring

From 2021, you can monitor the drought status on Windy in 3 different layers, thanks to our cooperation with CzechGlobe. On the drought intensity layer, you can view the soil drought status at a depth of 0 - 40 cm or 0 - 100 cm. The soil moisture layer shows you how saturated the soil is at these depths. You can also compare the values against the 1961-2010 average with the Moisture anomalies layer.


427 claps

Comments (4)

Thomas Gunter 643 days ago
@David-Polášek Are there any plans to add a layer for Wet Bulb Globe Temperature?
JRep65
JRep65 683 days ago
I think the Dew Point is most helpful for understanding my (summer heat wave) day.
From the United States.
Debanjan Chakrabarti
Debanjan Chakrabarti 726 days ago
@David-Polášek awesome
Ivan Cumpian
Ivan Cumpian 728 days ago
@David-Polášek interesting and very helpful! Thank you
Thermals: the invisible engine of unpowered flight
Jari Sochorová
-
updated 1 days ago
Windyty, S.E. Acquires Majority Stake in meteoblue, A.G.
-
updated 1 days ago
What's New in v50: Read the Avalanche Bulletins, Trace the Wind, Plan the Passage
Nicole Dolezalova
-
updated 1 days ago
Holiday Update: New Tools for Winter Weather and Ocean Forecasts, Meet Version 48
-
updated 8 days ago
Winter Weather: From Snowflakes to Extreme Snowfall
-
updated 16 days ago
What's New in v49: Faster, Smarter and made to Fly
-
updated 21 days ago
Windy Gets Smarter with Speed Vector and iOS Webcam Widgets
Nicole Dolezalova
-
updated 40 days ago
Spring in the Air: How CAMS Pollen Forecasts Are Made
-
updated 56 days ago
Earth Day with Windy: Understanding the Power of Our Planet
-
updated 58 days ago
From Storm Alerts to Forecasts on Your Garmin: Windy’s Biggest Update Yet
-
updated 91 days ago