
Thunderstorms are among the most striking and dramatic weather phenomena. On a global scale, thousands of thunderstorms occur each day. According to estimates, as many as 40,000 thunderstorms can form daily, and at any given moment, nearly 1,800 thunderstorm events may be happening simultaneously around the world. Their occurrence and intensity vary depending on the season and geographic location. The highest thunderstorm activity is typically observed during the warmer months when the atmosphere has ample energy available.
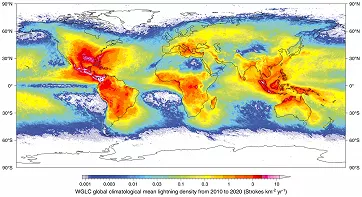
Climatological mean annual lightning stroke density (2010–2020); Earth System Science Data
In the Northern Hemisphere, we are now entering the second half of summer, which brings a gradual decline in thunderstorm activity. Days are getting shorter, solar energy is decreasing, and with it, the likelihood of strong thunderstorms is also diminishing. While May, June, and July are statistically the most active months, August and September tend to be calmer. Nevertheless, very strong and dangerous storms can still occur during this period.
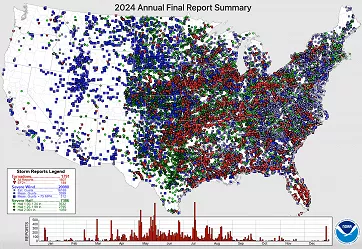
2024 Severe weather report for the USA; NOAA
Given their diversity, intensity, and impacts, thunderstorms deserve closer attention. In this article, we will focus primarily on on the conditions that lead to their formation and the factors that determine their strength.
What is a thunderstorm?
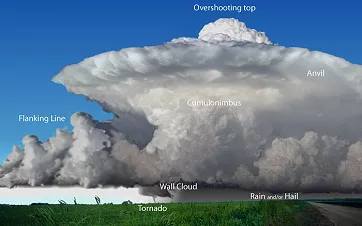
A thunderstorm, or convective storm, is a combination of optical phenomena (such as rain, hail, shelf cloud, wall cloud), electrical phenomena (lightning), and acoustic phenomena (thunder) that accompany the development of cumulonimbus cloud formations.
An observer at a meteorological station records a thunderstorm when lightning is seen and thunder is subsequently heard. The occurrence of these electrical and acoustic phenomena is the decisive criterion for officially recording a thunderstorm in the station log and marking it on a synoptic weather map. Precipitation or dark clouds alone, without accompanying lightning and thunder, are not sufficient for a thunderstorm to be recorded.
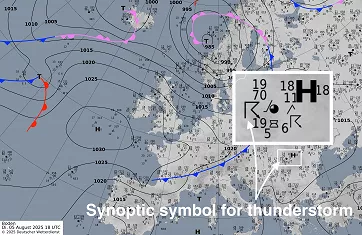
Synoptic chart of Europe issued by DWD for 5 August 2025, 18 UTC; DWD
Thunderstorm Project
Much of what we know today about thunderstorms comes from the Thunderstorm Project, carried out in the 1940s by the U.S. Weather Bureau. It was an exceptionally ambitious field research effort in which scientists used a network of surface measurements, radar observations, and aircraft flights through storm clouds to study thunderstorms in great detail. The project focused on thunderstorm activity over Ohio and Florida.

The Thunderstorm Project in Ohio, 1947; NOAA
One of the most important outcomes of this project was the development of the concept of the thunderstorm cell (single cell) and the identification of key structural components of thunderstorms: updrafts, downdrafts, inflow, outflow, boundary interfaces, and others.
Thunderstorm cell concept
The basic "building blocks" of every thunderstorm are thunderstorm cells. During its life cycle, a thunderstorm cell goes through three developmental stages: the cumulus stage, the mature stage, and the dissipating stage.
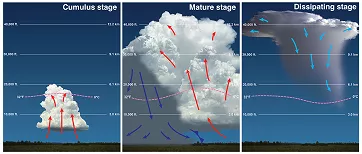
Life cycle of a thunderstorm cell; NOAA
The cumulus stage
In the growth stage, a thunderstorm cell is formed by an updraft of air rising from the surface. At first, it rises as an invisible “bubble.” When condensation or desublimation of water vapor occurs, a visible cloud begins to form, composed of cloud droplets or ice crystals.

Cumulus humilis; WMO
If the updraft weakens, the cloud stops growing and only small cumulus clouds (cumulus humilis) form, typical of calm, warm summer weather.
However, if the updraft is strong enough, the cloud continues to grow. Microphysical processes inside the cloud (e.g. collision and coalescence of particles) lead to the growth of droplets and crystals.
Once the particles become large enough that their weight overcomes the strength of the updraft, they begin to fall and form a downdraft.
Mature stage of a thunderstorm cell
During the mature stage, the cumulonimbus cloud reaches its full development, with both updrafts and downdrafts occurring simultaneously. This is the most intense phase of the thunderstorm cell, marked by strong precipitation and frequent lightning. The updraft can rise all the way to the tropopause, or even into the lower stratosphere, where it encounters warmer air that halts its ascent and forces it to spread horizontally. This process forms the characteristic anvil shape of the cloud, which can extend more than 100 km ahead of the storm core.

Cumulonimbus cloud with lightning and tilted updraft. Captured in Lošinj, Croatia. Photographer: Sandro Puncet (Croatia); WMO.
Above the anvil, vertical protrusions known as overshooting tops (also called "warm domes") often appear. These indicate a very strong updraft penetrating into the lower stratosphere. The updraft continues to be fueled by inflow, which supplies warm, moist air from below into the storm.
An idealized supercell; NOAA
The downdraft forms as a result of falling precipitation particles. The evaporation or sublimation of these particles cools the descending air, which then spreads out upon reaching the surface and creates what is known as a cold air outflow, a diverging current of cool air near the ground.
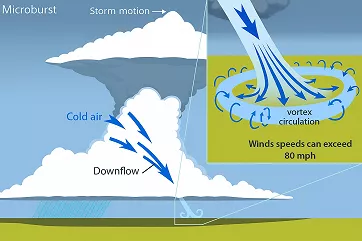
A microburst is a localized column of rapidly descending air within a thunderstorm, capable of causing severe surface damage and posing serious risks to life; NOAA
If the boundary between the cold outflow and the surrounding warm air is well-defined, it is referred to as a gust front. This boundary is often accompanied by gusty winds and can be visually identified by the presence of arcus clouds, such as shelf clouds.
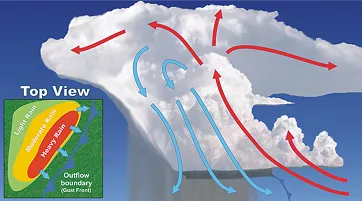
Diagram of updrafts and downdrafts in a thunderstorm, illustrating the gust front in a vertical cross-section and on a radar reflectivity image (small inset); NOAA
In the next stage of storm evolution, the leading edge of the outflow may extend as far as 200 km from the original location of the thunderstorm cell and can serve as a triggering mechanism for the formation of new thunderstorm cells.

Shelf cloud. Photographer: Danijel Palčić. Taken in Pag, Croatia; WMO
Dissipating stage of a thunderstorm cell
The final stage in the life cycle of a thunderstorm cell is the dissipating stage. At this point, the cold air outflow cuts off the supply of warm, moist air from the surface, effectively halting the updraft. This marks the end of the thunderstorm cell's life cycle.

Mammatus clouds belong to the late mature stage or early dissipation stage of a storm, when strong updrafts begin to weaken and the cloud starts to break apart; Met Office
During this phase, light precipitation typically dominates, with little or no significant thunderstorm activity. It is estimated that only about 20% of the condensed water vapor formed in the updraft reaches the ground. The rest either evaporates in the downdraft or remains as residual cloudiness, such as thinly scattered cirrus clouds, which gradually mix with the surrounding atmosphere and completely dissipate.
The updraft velocities measured during the Thunderstorm Project most frequently ranged between 5 and 10 m/s (18 and 36 km/h; 11 and 22 mph), occasionally exceeding 15 m/s (54 km/h; 34 mph). Downdrafts showed approximately the same velocity values, but were generally weaker than the updrafts. The vertical extent of the convective layer reached approximately 10 km. The lifespan of a single thunderstorm cell ranged from 30 to 40 minutes.
Essential ingredients for thunderstorm formation
What determines whether, on a warm and sunny day, only fair-weather cumulus clouds appear in the sky, or whether a towering thunderstorm cloud will develop?
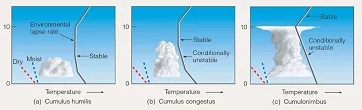
Stability/instability in the atmosphere and vertical extent of cloudiness: cumulus humilis, cumulus congestus, and cumulonimbus; Cengage 2012, atoc.colorado.edu
For thunderstorm clouds to form, three key conditions must be met:
Conditionally unstable atmosphere
Moist air in the lower and middle troposphere:
Moist air serves as the fuel for thunderstorms.When water vapor in the cloud condenses or desublimates, latent heat is released, which provides the storm with additional energy.Lift (also known as the triggering mechanism):
A triggering impulse is essential to initiate the upward movement of air to a level where it becomes warmer than the surrounding atmosphere and begins to rise autonomously, forming thunderstorm clouds. This impulse may originate from a frontal boundary, low-level convergence, differential surface heating, a dryline, a mountain slope, or even a small hill. Occasionally, an outflow of cold air from a nearby rain shower or thunderstorm may also initiate new convection. Accurately forecasting where such lift will occur remains one of the most challenging aspects of thunderstorm prediction.
What does it mean when the atmosphere is conditionally unstable?
Let’s start with the basics. A stable atmosphere resists upward motion, in such conditions, air rises only if some external force pushes it upward. An unstable atmosphere, on the other hand, encourages vertical motion. Whether the atmosphere supports or suppresses upward movement depends on its temperature stratification, specifically on how rapidly the temperature decreases with height.

Illustration demonstrating air parcel stability and instability. The bowl represents the atmospheric state, while the red ball symbolizes an air parcel that receives energy to initiate movement; NOAA
Atmospheric stability is most commonly assessed using the air parcel method.
Imagine a bubble of air. As it is lifted, it begins to cool due to expansion. This happens because the pressure decreases with altitude in the atmosphere, causing the parcel to expand and lose heat.
Several physical assumptions apply to our air parcel. For instance, we assume that it cools adiabatically, meaning without exchanging heat with its surroundings.
If the air is dry, the parcel cools at a rate of approximately 10 °C per kilometer. However, if it contains enough water vapor, condensation might begin as it cools. This process releases latent heat, which slows the rate of cooling, typically reducing it to between 4 and 7 °C per kilometer.
And this is where conditional instability comes into play. It occurs when the temperature decreases with height in such a way that:
A dry air parcel is cooler than the surrounding air as it rises and therefore tends to sink back to its original position. In this case, the environment is stable for the dry parcel.
A saturated parcel is warmer than the surrounding air as it rises and continues to rise due to buoyancy. In this case, the environment is unstable for the saturated parcel.
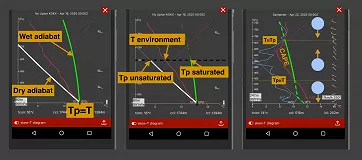
Example of conditionally unstable temperature stratification on the Skew-T log-P diagram (Windy.com): The red curve shows the environmental temperature profile, T is the measured air temperature at a level, Tp is the air parcel temperature. The blue bubble represents an air parcel with arrows showing buoyant force direction; Windy.com
Our air parcel could rise from the ground in a conditionally unstable atmospheric profile as follows:
At the beginning, the temperature of our air parcel is the same as the surrounding air (environment). To start rising, the air parcel needs a lifting mechanism.
As it ascends, it cools at the dry adiabatic lapse rate (approximately 10 °C per kilometer, as shown on a thermodynamic diagram following the dry adiabat).
As the air parcel cools, its humidity increases until it reaches 100%, causing condensation to begin and a visible cloud to form. The height where this saturation occurs is called the lifting condensation level (LCL).
During further forced ascent, it cools at the moist adiabatic lapse rate (as shown on a thermodynamic diagram following the moist/wet adiabat).
At the level of free convection (LFC), its temperature equals that of the surrounding air.
Above this level, the air parcel becomes warmer than its surroundings and begins to rise freely due to buoyancy.
The parcel will rise freely until its temperature matches that of the surrounding air once again (the level of neutral buoyancy), at which point its ascent will begin to slow. This occurs no later than the tropopause, where temperature starts to increase sharply with altitude.
During intense thunderstorms, an air parcel can ascend all the way through the troposphere, sometimes reaching the tropopause and even slightly entering the lower stratosphere.
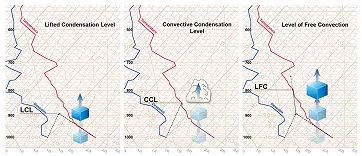
Significant levels on the thermodynamic diagram: LCL, CCL, LFC; NOAA
The amount of energy available to our air parcel for rising due to buoyant force can be expressed by a quantity called CAPE, which stands for Convective Available Potential Energy. It is one of the key parameters in meteorology, describing the degree of atmospheric instability, and therefore the potential for the development of convective phenomena such as thunderstorms, showers, or hazardous accompanying weather events.
One might ask whether an absolutely unstable atmosphere is also favorable for thunderstorm development. That is, an atmosphere that is unstable for both dry and saturated air parcels. The answer is no. This type of stratification leads to strong turbulent mixing, which quickly restores thermal equilibrium within the affected layer of the atmosphere. Therefore, absolute instability occurs only rarely, typically in a shallow layer near the surface. This can happen, for example, during intense solar heating or when very cold air moves over a warm body of water.
The role of wind shear in the dynamics of convective storms
Conditional instability, moisture, and a lifting mechanism influence the development and intensity of the upward air motion. Another important parameter that plays a significant role in the dynamics of convective storms is wind, particularly its direction and speed at different altitudes above the ground. The change in wind speed and direction with height is known as wind shear. Although wind shear is not essential for thunderstorm initiation itself, it has a crucial impact on storm structure.
The strength of the shear causes a vertical tilt of the updraft and downdraft.
In weak shear conditions, the downdraft often cuts off the updraft from the supply of moist air in the lower troposphere, which leads to the rapid dissipation of the storm.
On the other hand, strong wind shear tends to separate and tilt these flows, allowing for the development of a more intense and longer-lasting storm, with a greater likelihood of producing hazardous accompanying phenomena.
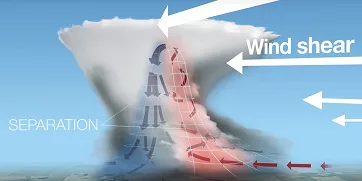
A storm with little wind shear has a vertical updraft quickly weakened by rain, while strong wind shear causes a tilted updraft that keeps rain away from it; BOM
When everything falls into place…
When atmospheric instability, a lifting mechanism, and wind shear come together in the right combination, very powerful thunderstorms can develop.
These storms may be accompanied by a wide range of hazardous phenomena, such as strong gusty winds, downbursts (microbursts), derechos, heavy rain, flash flooding, hail, lightning, and even tornadoes. Such events can cause extensive damage to property, disrupt infrastructure, and pose a serious threat to human life.
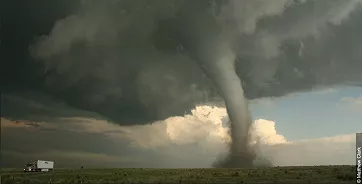
Tornado; WMO
How to observe thunderstorms on Windy.com
Windy.com provides a range of interactive layers and tools that allow users to monitor ongoing thunderstorms and analyze the conditions that may lead to their development.
For direct observation of thunderstorms, the following layers are especially useful:
Radar – shows current precipitation. Intense storms appear as well-defined cores with high reflectivity.
Satellite – displays cloud cover.
On VIS (visible spectrum) images, storm structure such as overshooting tops can be clearly seen during daylight hours.
On NIR (near-infrared) images, vertically extensive thunderstorm clouds have very cold tops that are represented by a color scale on the NIR product, making them easy to identify.
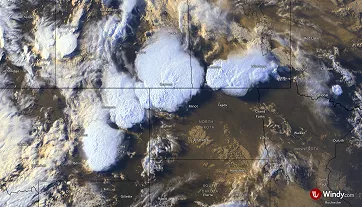
Satellite image capturing severe thunderstorms over the Northern Plains and Canadian Prairies, 7 August 2025; Windy.com
To analyze thunderstorm potential, these tools and forecast layers are helpful:
Radiosondes (Sounding) – helps evaluate the temperature profile and atmospheric instability.
CAPE – the higher the value, the more energy is available for convection. Values above 1000 J/kg suggest a potential for strong thunderstorms.
Rain and thunderstorm – a forecast layer showing modeled precipitation and thunderstorm activity.
Wind at altitude – wind direction and speed at various pressure levels (e.g., 850 hPa and 500 hPa) can reveal the presence of wind shear, which plays a key role in storm organization (e.g., multicell or supercell development).
Pressure fields and fronts – thunderstorms often form in low-pressure zones, along frontal boundaries, or in convergence areas, which are clearly visible on the pressure map.
The combined use of these data provides both a real-time overview of storm activity and valuable forecasts of where new thunderstorms are likely to develop within the coming hours.
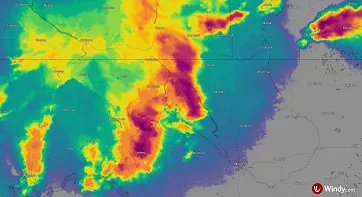
Image of radar reflectivity capturing severe thunderstorms over the Northern Plains and Canadian Prairies, 7 August 2025; Windy.com
Comments (11)