Weather radar is one of the most powerful tools in modern meteorology. It allows us to look inside precipitation systems and measure their intensity, structure, movement, and development, details that satellites and ground stations alone cannot provide. This article explains how weather radar works, what it measures, what radar reflectivity is, and how to interpret the data.
Typhoon Co-May (July 2025) brought heavy rain and strong winds to the Philippines, the Ryukyu Islands, and eastern China. It developed into a long-lasting typhoon with winds up to 130 km/h; Windy.com
Where did RADAR come from?
RADAR is an acronym for RAdio Detection And Ranging, meaning “radio detection and distance measurement.” The word “radio” refers to the radio waves transmitted and received by radar.
Just like many great inventions, radar was born out of chance discoveries. In 1922, the steamer Dorchester on the Potomac River disrupted a Navy radio experiment, hinting that radio waves could be used to detect ships under cover of darkness. The idea was forgotten, but in 1934 a passing airplane once again disturbed a radio signal, this time sparking the breakthrough concept of using short energy pulses to locate targets (R. E. Rinehart, Radar for Meteorologists, 2004).
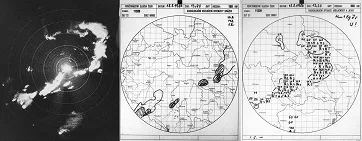
Precipitation clouds on a radar display unit (left); Routine plot of hourly precipitation intensity (center), and radar reflectivity (right), 1986; CHMI via Root
The first principles of radar technology began to take shape as early as the 1930s. Initially, development was focused mainly on military applications, particularly the detection of aircraft and ships. During World War II, however, operators noticed that radar screens often also displayed bands of precipitation, which made it more difficult to track intended targets. This “side effect” later became the impetus for the postwar scientific use of radar in meteorology.
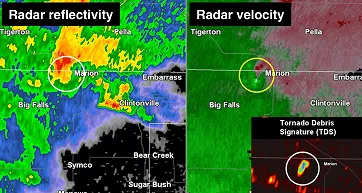
Radar reflectivity (left) and radar velocity (right) around time of an EF1 tornado west of Marion, Wisconsin; NSSL
In the 1950s and 1960s, the first radars designed specifically for weather monitoring were developed, capable of displaying the location and intensity of precipitation. In the 1970s, Doppler radars came into use, able to measure the velocity of moving precipitation particles. Another major advance came in the 1990s with the introduction of dual polarization, which made it possible to distinguish the shape and type of detected particles (rain × snow × hail).
Base reflectivity showing light precipitation over North Texas on February 14, 2021 (left) and the corresponding Differential reflectivity from dual-polarization at the same time (right); NOAA
Today, weather radars are an integral part of both national and international networks. They make it possible to monitor the weather with high spatial and temporal resolution and to provide timely warnings of hazardous phenomena, from heavy rainfall and hail to tornadoes.
How radar measures
The basic operating principle of a weather radar can be illustrated using a pulsed Doppler radar. This type of radar is now widely used and employed by national meteorological services around the world.
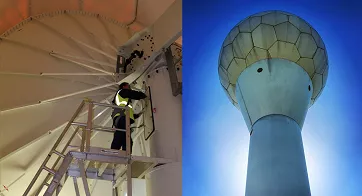
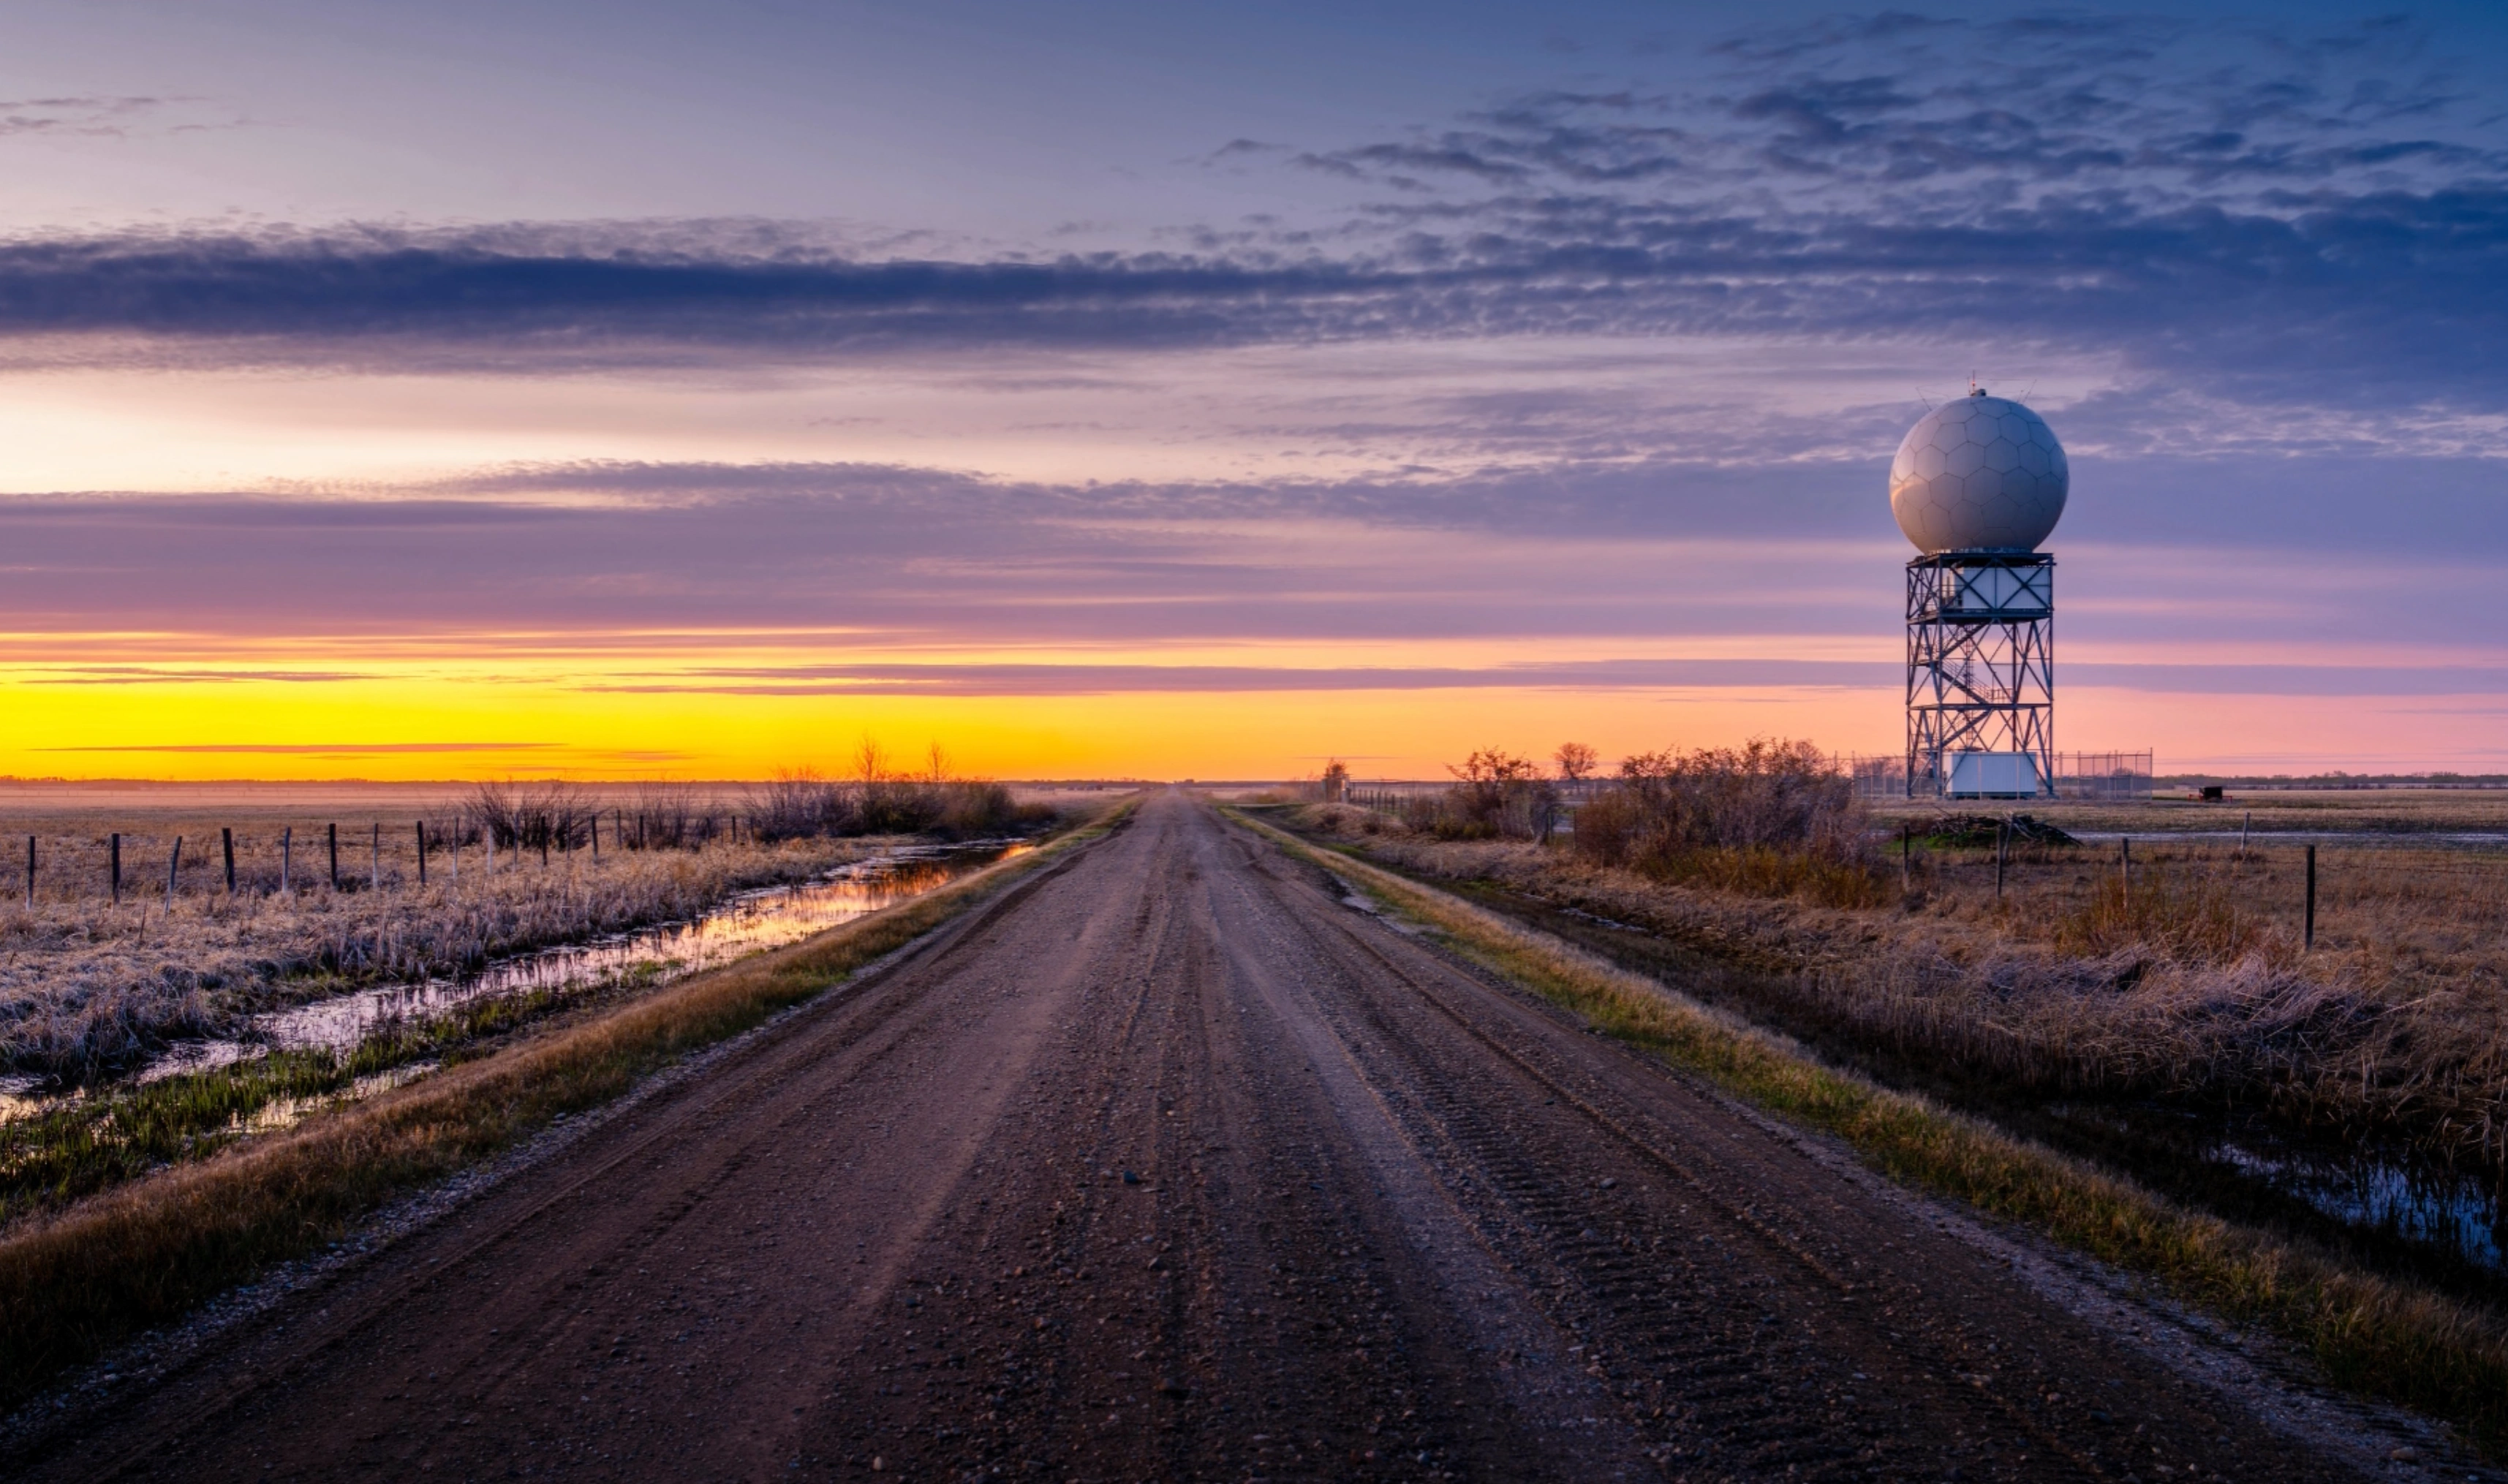
Beneath the radar’s circular dish (left) and the Laverton radar near Melbourne (right); BOM
A radar consists of several main components: a transmitter that generates a high-frequency signal; an antenna that transmits this signal into space and simultaneously receives its echoes; a receiver that amplifies the returned signal; and a display system that makes it possible to clearly interpret the results.
The radar transmits a pulse and listens for a returned signal from a target; NOAA
The first weather radars transmitted a continuous signal and therefore required two separate antennas: one for transmitting and one for receiving. Modern radars, however, work differently. They use a single antenna and emit short pulses of energy instead of a continuous beam. After each pulse, the radar waits for the echo to return before sending the next. Because radio waves travel at the speed of light, the echoes return within fractions of a second, even from targets hundreds of kilometers away. In each hour, the radar spends just over 7 seconds transmitting pulses. The remaining 59 minutes and 53 seconds are devoted to listening for the echoes.
Most radars used in operational meteorology operate in a volume-scanning mode, in which both the azimuth and the elevation angle of the antenna system can be varied. The antenna repeats circular scans at 10 to 20 different elevation levels, usually ranging from 0.3° to 20°. The entire process takes about 4 to 6 minutes and provides a three-dimensional picture of the atmosphere.
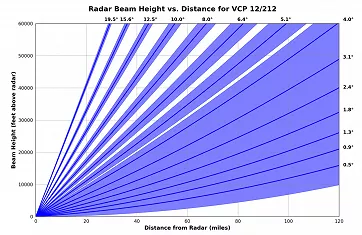
The WSR-88D scans a predetermined set of elevation angles to complete a volume scan. During active weather, Volume Coverage Pattern (VCP 12 or 212) is used. This VCP includes 14 elevation angles and takes about 4.5 minutes to complete; NOAA
Once the radar receives the reflected signal, the receiver must first amplify it. To illustrate: the WSR-88D radar used in the U.S. NEXRAD network transmits a pulse with a power of 750,000 watts, but only a tiny fraction of that returns. Only then does the display system take over, processing the data further and converting it into visual form.
How a radar beam propagates through the atmosphere
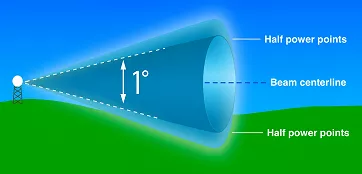
For simplicity, we can imagine a radar beam as a cone of light from a flashlight. The strongest signal is in the center, while it weakens and gradually spreads toward the edges. Close to the radar, even fine details can be seen, but at greater distances they fade, and the radar’s resolution decreases.
Depiction of the WSR-88D radar beam; NOAA
As the distance from the radar increases, its beam gradually rises above the surface due to the curvature of the Earth. At greater distances, the radar can no longer capture conditions close to the ground, which are the most important from a weather perspective.
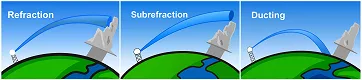
Diagram of radar beam propagation through the atmosphere under different meteorological conditions; NOAA (slightly modified)
In a vacuum, a radar beam would propagate in a straight line, but in the atmosphere it bends slightly due to changes in air density and refractive index. Under normal conditions, it curves gently toward the Earth. However, if the vertical profile of temperature and humidity deviates significantly from the norm (for example during a temperature inversion), anomalous propagation may occur, causing the beam to bend more strongly toward the Earth, or away from it.
What does a weather radar see?
A weather radar measures the power of the electromagnetic signal reflected from particles in the atmosphere. This power is influenced both by the technical parameters of the radar (e.g., transmitted power, wavelength, pulse length, antenna gain, or beamwidth) and by the reflectivity of the target, and it decreases rapidly with distance. This relationship is described by the so-called radar equation.
Weather radars are tuned to best capture the backscatter from precipitation particles, such as raindrops (from drizzle to large drops in heavy showers), snowflakes, or hail.
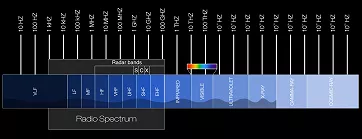
Electromagnetic spectrum with the radio frequency range and the S, C, and X bands highlighted; NASA (with radar bands added)
S-band radars operate at wavelengths around 10 cm. These waves penetrate even heavy precipitation well, which is why they are often used in regions with severe thunderstorms, tropical downpours, and hurricanes.
C-band radars operate at wavelengths around 5 cm and are suitable for areas where heavy rain is less frequent, so signal attenuation is not as significant.
X-band radars operate at wavelengths around 3 cm. They can detect smaller cloud particles and light precipitation, but their signal is quickly weakened in heavy rain.
In addition to precipitation particles, and sometimes clouds, radars also register so-called non-meteorological echoes, such as those from birds, insects, aircraft, ships, or the Earth’s surface.
How far from the radar is it raining?
The distance from which the reflected signal returned can be determined easily: measure the time between transmission and reception, multiply it by the speed of light, and divide by two, because the pulse traveled the path twice, out and back.
Radar emits pulses of electromagnetic energy, part of which is scattered back toward the radar; UCAR MetEd COMET
The waiting time before the radar sends the next pulse determines its maximum range, i.e., the distance within which the reflected signal can be uniquely assigned to the transmitted pulse. A longer delay between pulses allows the radar to detect more distant targets, but it also reduces temporal and spatial resolution. In addition, the beam weakens as it travels through the atmosphere and rises higher above the Earth’s surface with distance. Setting the delay is therefore always a compromise between range and measurement quality.
Radar reflectivity
Radar reflectivity, derived from received power, is one of the primary weather-radar products and is likely the most familiar to the public. It represents the intensity of the backscattered signal. Reflectivity depends mainly on the size of precipitation particles (it is strongly weighted toward larger drops) and, to a lesser extent, on their concentration.
The base unit of reflectivity is mm⁶/m³, as given by the radar equation. Raw values span many orders of magnitude: tiny water droplets are about 0.001 mm⁶/m³, while hail in severe storms may reach 36 million mm⁶/m³. For practicality, reflectivity is expressed on a logarithmic scale as decibels of reflectivity (dBZ). Typical measured values of radar reflectivity range from –35 dBZ to +85 dBZ; in general, higher dBZ corresponds to heavier precipitation.
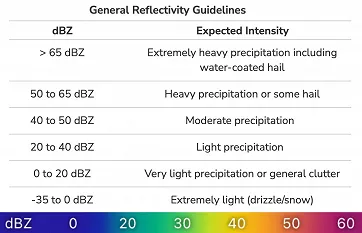
General reflectivity guidelines; NOAA (color scale by Windy.com)
Base reflectivity
Base reflectivity shows the intensity of rain or snow as seen by the radar at a low angle above the horizon (around 0.5°). It gives a clear picture of where precipitation is falling and how strong it is.
This product is especially useful for spotting details inside storms, like hook echoes, gust fronts, or new cells forming near the ground. Its limitation is that it only shows the lowest slice of the atmosphere, so the full vertical structure of storms can be missed. Close to the radar, the image may also be distorted by echoes from terrain or buildings.
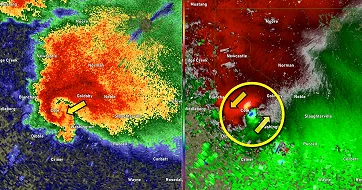
Base reflectivity shows a hook echo near Oklahoma City on April 19, 2023 (left); Velocity data confirm tornado rotation (right); NOAA
Composite reflectivity
Composite reflectivity is one of the most commonly used radar products. It displays the highest reflectivity value above a given location. It is useful for a quick overview of the strength and distribution of convection and for detecting the first signs of thunderstorm development. It also allows monitoring of larger-scale systems, such as squall lines or multicell storms.
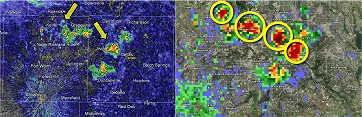
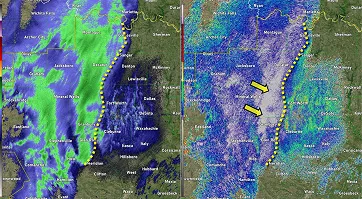
Base Reflectivity shows weak scattered storms over Dallas-Fort Worth, while Composite Reflectivity reveals their stronger structure; NOAA
For detailed storm analysis, however, it is less suitable, since maximum reflectivity values cannot be assigned to a specific altitude and finer storm features (e.g., hook echoes) are often obscured.
Instantaneous precipitation intensity
Radar reflectivity can be converted into instantaneous precipitation intensity (mm/h, in/h) using empirically derived relationships between drop size distribution and rainfall rate. These conversion formulas are known as Z–I relationships.
Why radar images can be misleading
Radar images are an invaluable tool for monitoring precipitation and storms. Their interpretation, however, is not straightforward, since the captured signal can be influenced by a variety of interfering factors. Some of these effects can be partially filtered out. The most common issues include:
Ground and object echoes
In addition to precipitation, radar can also capture unwanted echoes from ground targets such as buildings, hills, or trees. These may occur when anomalous propagation of the radar beam happens due to very stable atmospheric layering. Such “ground clutter” echoes can be partially filtered out. Radar can also detect echoes from other non-meteorological targets.
Range folding
Sometimes so-called “second-trip echoes,” or “range folding,” appear in the image. These are reflections that return only after the next pulse and are therefore displayed in the wrong location.
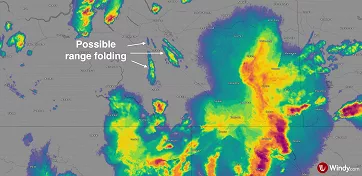
Possible range folding: false echoes that are typically narrow and elongated along the radar beam axis; Windy.com
Attenuation of the radar beam
As a radar beam travels through the atmosphere, its intensity decreases due to absorption and scattering by gases, water vapor, clouds, and precipitation. Passing through heavy rain or hail, part of the signal’s energy is lost, which can cause precipitation behind the storm core to be underestimated.
Interference from external signals
Radar can also be affected by other sources operating at similar frequencies, such as telecommunication transmitters or even the Sun. In such cases, strange lines or streaks may appear on the radar images.
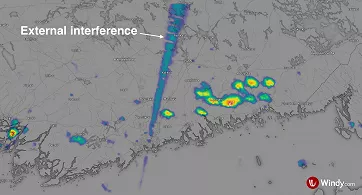
External interference; Windy.com
Conversion of reflectivity to rainfall
Errors in estimating rainfall intensity arise already from the use of the Z–I relationship itself. It is based on an assumed drop size distribution of precipitation particles. In reality, however, these distributions are highly variable and cloud-specific, which makes it impossible to accurately convert radar reflectivity into rainfall intensity.
Presence of hail
In radar measurements, it is assumed that the radar detects only particles much smaller than the signal’s wavelength, so the echoes follow Rayleigh scattering. Hailstones, however, are much larger and scatter the signal in a different way. Another assumption is that all particles have the same composition, but in reality reflectivity depends on what they are made of and whether they are liquid or frozen. Because of this, hail often appears on radar with unusually high reflectivity values.
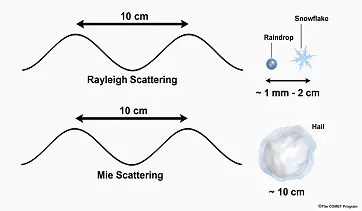
Small particles follow Rayleigh scattering, large particles follow Mie scattering; UCAR MetEd COMET
Enhanced reflectivity at the freezing level (Bright band):
In the melting layer of solid precipitation below the freezing level, enhanced radar reflectivity is often observed, typically increasing by 5 to 15 dBZ. This effect results from changes in the composition of precipitation particles. Enhanced reflectivity is mainly associated with stratiform precipitation. By contrast, strong updrafts within convective clouds tend to disrupt the horizontal stratification that is essential for the formation of this band.
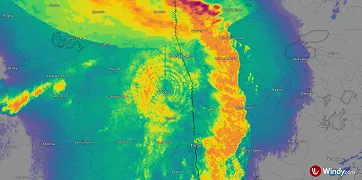
Concentric rings around the radar in stratiform rain are caused by enhanced reflectivity at the freezing level (the bright band) and by the geometry of the radar scan; WIndy.com
Processes below the radar beam:
Evaporation of precipitation below the beam (virga) - If the air near the surface is dry, raindrops or snowflakes may evaporate (or sublimate) before reaching the ground. In such cases, the radar shows precipitation that never actually reaches the surface.
Increase in precipitation intensity - On the windward slopes of hills, rainfall may intensify due to orographic effects, causing the radar to underestimate the actual amounts.

Virga; WMO
Radar on Windy.com
Windy.com now provides radar data from approximately 1,000 weather radars worldwide, and the number continues to grow. To keep the data as accurate as possible, removable measurement errors are automatically filtered out.
In the Radar layer, you’ll find the Composite reflectivity product, which you can display either in dBZ or as the current precipitation intensity (mm/h or in/hr).
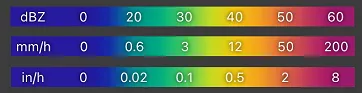
Color scale of reflectivity and converted precipitation intensity (the scale can be adjusted as needed); Windy.com
In the Radar+ layer, composite radar reflectivity data are combined with satellite observations, providing a clear, detailed view of the formation and evolution of clouds and precipitation and enabling more reliable identification of false echoes by comparing the radar reflectivity field with satellite imagery.
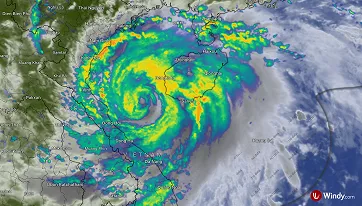
Typhoon Kajiki made landfall along Vietnam’s coast near Vinh on Monday, August 25, 2025.; Windy.com
From the radar echoes, Windy also generates a short-term alerts of precipitation movement for the next 60 minutes using interpolation, so you can see not only where it’s raining or snowing right now, but also what’s on the way.
And so a downpour never catches you off guard, you can now enable rain alerts. Windy will notify you in advance when heavy rain is approaching.

Comments (3)
Please make it easier to read these articles full screen, rather than only side bar. That would help in reading and graphics.
Thank you.